Environmental Engineering Reference
In-Depth Information
1.001.00 1.00
1.0
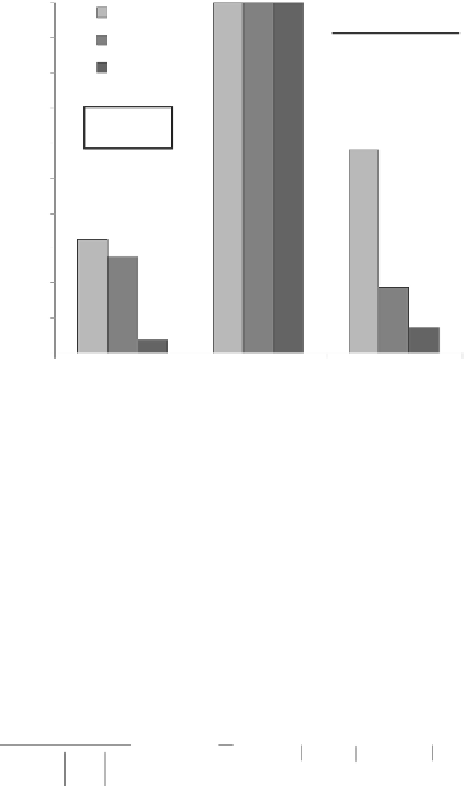
Load test result for
n
30-m long piles:
Sample average
=
700 kN
Standard deviation
=
20 kN
n
=
1
n
=
2
n
=
4
0.9
0.8
0.7
ρ
i
,
j
=
0
0.58
0.6
0.5
0.4
0.33
0.27
0.3
0.19
0.2
0.07
0.1
0.03
0
1 1.3 1.6
Gradient of units side shear versus depth, θ (kPa/m)
Figure 13.19
Likelihood functions for model parameter given an average load test result from n independent
pile load tests in pile foundation design.
in pile capacity between locations is divided into systematic and random components,
σ
=+, where σ
s
is the standard deviation of the systematic component and σ
r
is the
standard deviation of the random component, then the correlation coefficient between two
test results ε
i
and ε
j
is the percentage contribution of the systematic variance to the total vari-
ance, ρ
2
σ
2
σ
2
s
r
R
θ
2
2
σ
σσ
σ
σ
s
s
=
=
.
The probability of measuring a set of correlated capacities,
ε
ij
,
2
+
2
2
s
r
R
θ
εε ε
=
1
,,,
…
n
is obtained from the multivariate normal distribution
1
1
2
dd
P
(, ,
ε
…=
ε
θ
)
×
exp
−
(
ε
−
µ
)
T
C
−
1
(
ε
−
µ
)
ε
ε
1
(13.17)
1
n
R
θ
R
θ
12
/
R
θ
()
2
π
n
/
2
C
R
θ
where µ
R
is an
n
× 1 vector of mean pile capacities and C
R
θ
is an
n
×
n
covariance matrix with
diagonal terms equal to σ
θ
ε
ij
,
2
The likelihood function
in this case is a function of the sample mean and the sample standard deviation of the individual
load test results,
m
ε
and
s
ε
, respectively. This likelihood function is shown in
Figure 13.20
as a
function of the correlation coefficient
ρ
ε
i
,
for an example set of test results; the sharpness of the
likelihood function is reduced as the systematic variation increases relative to the total variation
between test results. There are two limiting cases for systematic variations: if the variation error
is zero, then ρ
ε
i
,
= 0 and the likelihood function reduces to the case of independent test results
(
Equation 13.16
);
if there is only systematic variation, then ρ=
2
and off-diagonal terms equal to ρσ
θ
R
θ
ε
i j
,
1 and the likelihood function
reduces to the case of a single-test result (
Equation 13.15
),
since εε ε
1
n
Finally, consider the possibility of performing proof load tests where the test result is
either that the test pile does or does not hold a proof load. The probability of measuring a
set of independent proof test results is given by
===
.
2
{
}
∏
n
−
n
successes
P
(, ,
ε
…=
ε
θ
)
P
(
r
>
ε
)
n
× −>
1
P
(
r
ε
)
successes
(13.18)
1
n
proof
proof
all
ε
i


Search WWH ::

Custom Search