Environmental Engineering Reference
In-Depth Information
1.00 1.00 1.00
1.0
0.9
ρ
i
,
j
=
0.0
ρ
i
,
j
=
0.25
ρ
i
,
j
=
0.5
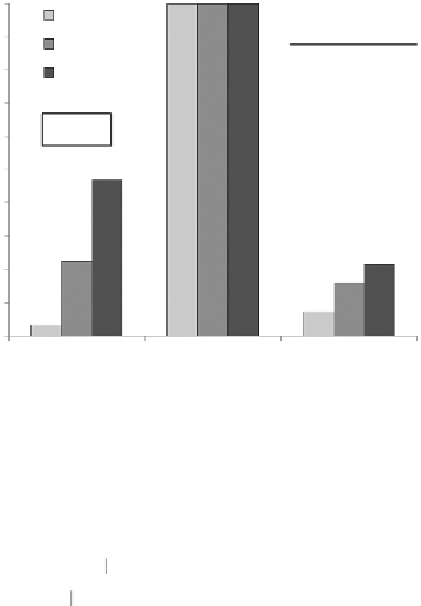
Load test result for
n
30-m long piles:
Sample average
=
700 kN
Standard deviation
=
20 kN
0.8
0.7
n
=
4
0.6
0.5
0.47
0.4
0.3
0.23
0.22
0.2
0.16
0.07
0.1
0
0.03
1 1.3 1.6
Gradient of units side shear versus depth, θ (kPa/m)
Figure 13.20
Likelihood functions for model parameter given an average load test result from a set of cor-
related pile load tests in pile foundation design.
where ε
proof
is the proof load,
n
successes
is the number of successful test results in
n
tests, and
ε
−
µ
proof
R
θ
P
(
r
>
ε
)
=
1 Φ
−
(13.19)
proof
σ
R
θ
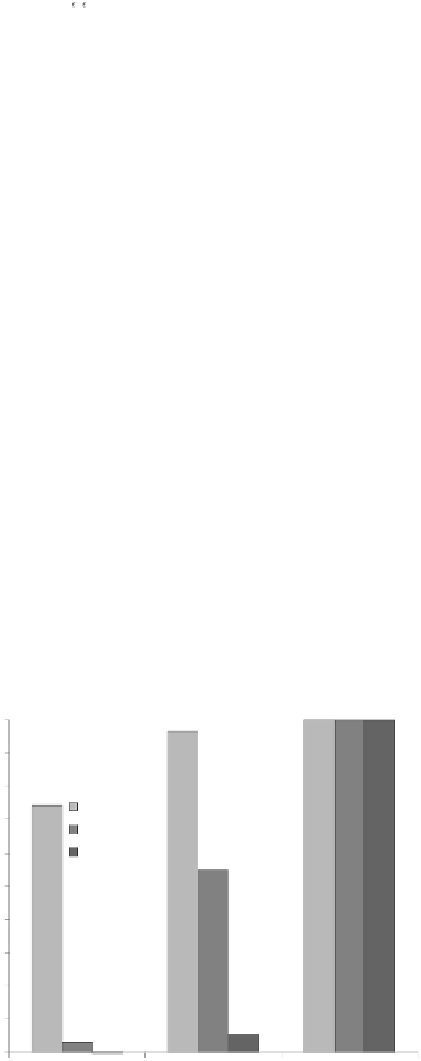
for an example set of test results. The likelihood function becomes sharper as the proof
load increases since the result (three passing tests out of three proof tests) can be readily
ree out of three proof
load tests are
passed
1.001.001.00
1.0
0.96
0.9
0.8
0.74
Load = 400 kN
Load = 600 kN
Load = 800 kN
0.7
0.6
0.55
0.5
0.4
0.3
0.2
0.1
0.05
0.03
0.00
0
1 1.3 1.6
Gradient of units side shear versus depth, θ (kPa/m)
Figure 13.21
Likelihood functions for model parameter given a result for a set of proof load tests with dif-
ferent proof loads in pile foundation design.


Search WWH ::

Custom Search