Biology Reference
In-Depth Information
a causal link between APE1 repair activity and neuro-
protection after ischemia.
Using isolated sensory neurons grown in culture, we
examined the effects of altering APE1 expression on
DNA damage and cell death induced by oxidative
stress.
188
Hippocampal and sensory neuronal cultures
from adult rats were exposed to various concentrations
of H
2
O
2
for 1 hour. Cell death, caspase activity, and
phosphorylation of H2AX were examined at various
times after oxidative stress using separate cultures of
neurons. We showed that H
2
O
2
caused a concentration-
dependent increase in cell death, increased caspase
activity, and increased histone phosphorylation. When
APE1 expression was reduced using siRNA, all three
parameters of toxicity were enhanced after H
2
O
2
.
Conversely, when APE1 was overexpressed in the
neuronal cultures, the effects of H
2
O
2
were attenu-
ated.
188
We confirmed this work using menadione to
induce oxidative damage in sensory neuronal cultures.
In these studies, neuronal cultures were exposed to
various concentrations of menadione for one hour, and
cell death was measured at 24 hours after treatment
using trypan blue exclusion.
Figure 13.2
A shows that
menadione produced a concentration-dependent
increase in cell death in sensory neurons treated with
a scramble siRNA. Exposing sensory neuronal cultures
to this siRNA did not alter APE1 expression in the
neurons. When cells were treated with APE1siRNA the
(A)
(B)
(C)
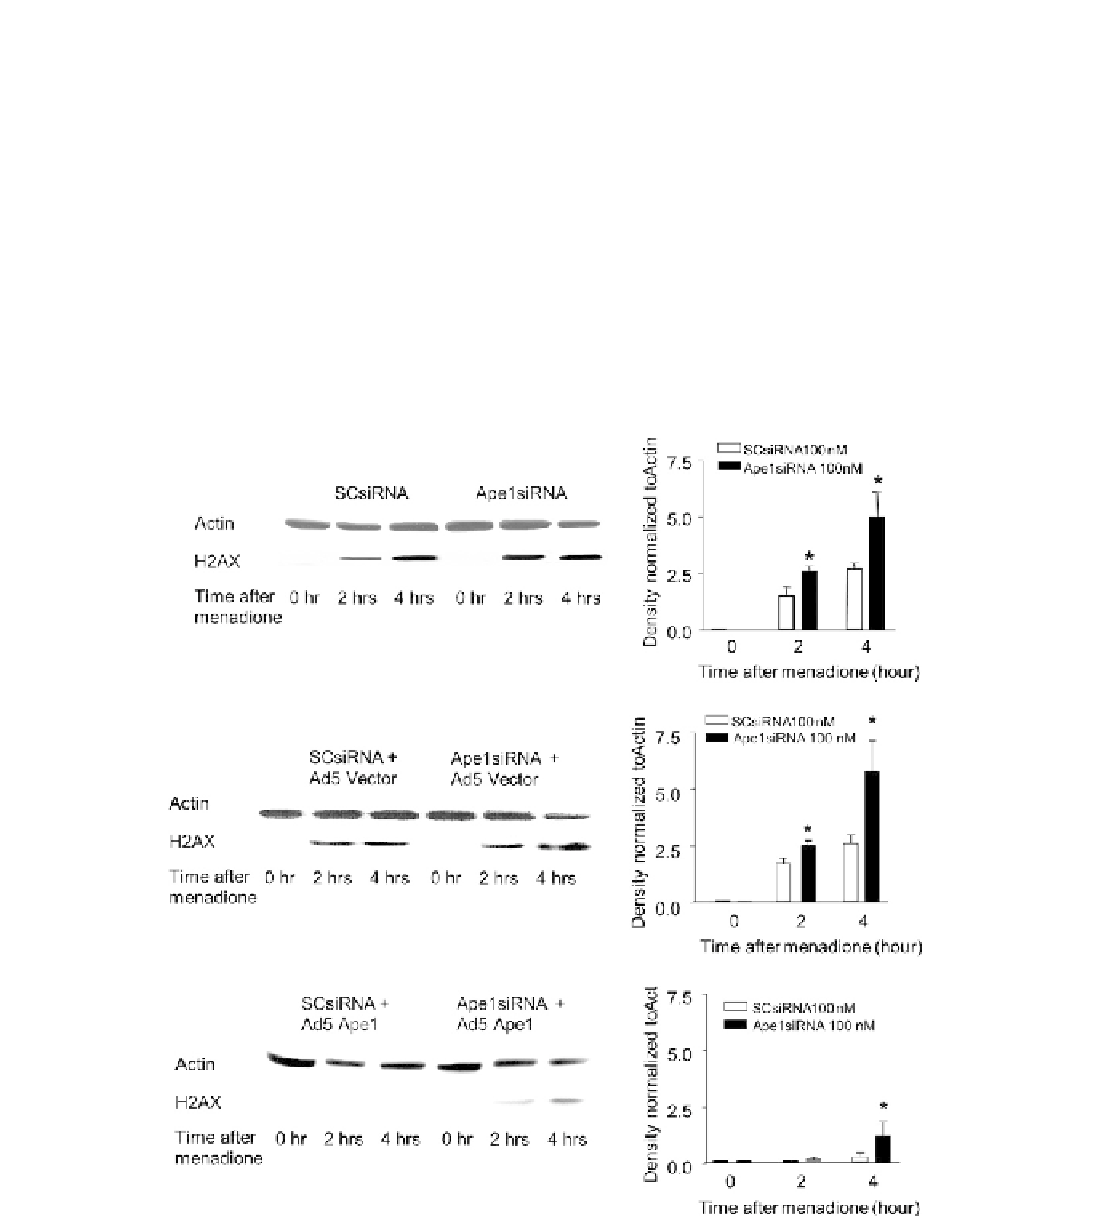
FIGURE 13.3
Menadione-induced phosphorylation of H2AX in sensory neuronal cultures is increased by a reduction in APE1 expression
and attenuated by APE1 overexpression. The panels on the left show representative immunoblots of phosphorylated H2AX from sensory
neuronal cultures at various times after exposure to 3
M menadione. Cultures were exposed to either SCsiRNA or APE1siRNA as indicated and
not infected (A), infected with an adenoviral construct containing the CMV promoter and EGFP (B; Ad5 vector) or a construct containing the
CMV promoter, human APE1, IRES, and EGFP (C; Ad5-APE1). The panels on the right represent the summary of the density of the phospho-
H2AX bands from three independent harvests normalized to the amount of actin. The columns represent the mean
m
SEM from cultures exposed
to scramble siRNA (open columns) or APE1 siRNA (shaded columns) for the times indicated after menadione treatment. An asterisk indicates
a statistically significant difference in cultures treated with scramble siRNA versus cultures exposed to APE1siRNA using analysis of variance
and the Tukey post-hoc test.