Environmental Engineering Reference
In-Depth Information
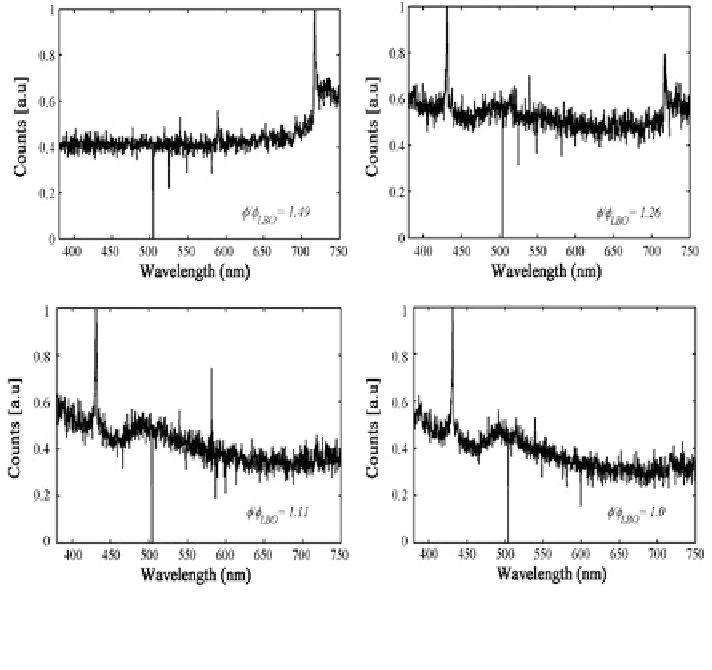
Fig. 11 Spectrometer spectrum for different
Φ
/
Φ
LBO
clearly shows the variation of colors from
their different dominating wavelength peak as
Φ
approaches to
Φ
LBO
(Q
air
= 80 LPM,L
fuel
= 35 cm)
(Chaudhari et al.
2013
)
Fig.
12
. Again, for each selected L
fuel
and air
ow rate (Q
air
), three different runs
have been taken to estimate the percentage error. It is found that error percentage
for most of the readings lies within
fl
10 %.
From Fig.
12
, it is clearly observed that irrespective of the L
fuel
and the air
±
fl
ow
condition used,
γ
decreases monotonously with equivalence ratio, which justi
es
the choice of
as LBO detection metric for sensing the proximity of combustor to
blowout. As evident from the
γ
figure, a set threshold (
c
thresh
) on the value of
γ
would
be suf
cient to detect proximity to blowout for this particular con
guration. Setting
c
thresh
0
:
3 would provide a reasonably safe margin of
/
Φ
LBO
≈
1.2
1.3 for all
Ф
-
the
flow rates and premixing lengths considered, with the higher ratio corre-
sponding to the more premixed configuration (L
fuel
= 35 cm). Since premixed
fl
fl
flames are more susceptible to lean blowout, a higher safety margin for this con-
figuration is advantageous. A single threshold value for different con
figuration and
fl
flow condition would simplify the development of controller for preventing
blowout. Again, selection of threshold value (
c
thresh
) is not limited to
fixed value
and can be varied depend upon the safety margin required. Another advantage of
Search WWH ::

Custom Search