Environmental Engineering Reference
In-Depth Information
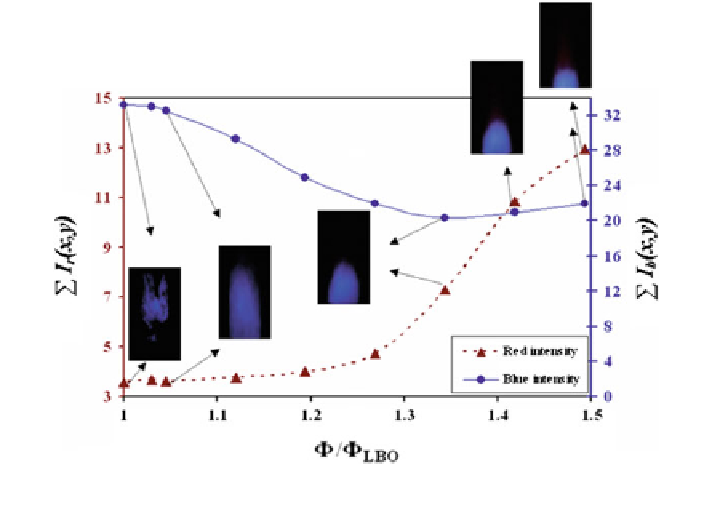
Fig. 10 Variation of red and blue color intensities with flame modes for different equivalence
ratios (port 1) (Chaudhari et al.
2013
)
emission band in visible spectrum. As the equivalence ratio is further reduced, the
dominating 700-nm peak in spectrum diminishes and the spectrum shows peak
around 432 nm wavelengths, which is close to blue color emission band wavelength
in the visible spectrum. The results of the spectrometer are consistent with the color
analysis of
flame carried by camera.
We explain this color observation as follows. In the most common hydrocarbon
fl
fl
flames, the most important factor determining
fl
flame color is oxygen supply and the
extent of fuel
oxygen premixing which determines the rate of combustion and thus
the temperature and reaction paths, thereby producing different colors. At higher
equivalence ratio (
-
Φ
), the presence of incandescence of very
fine soot particles
produced in the
flame reddish. With increasing oxygen supply (lean
condition), less soot is produced due to more complete combustion and the reaction
creates enough energy to excite and ionize gas molecules in the
fl
ame makes
fl
fl
flame, leading to
blue appearance of leaner
fl
ame.
with equivalence ratio for a range of
parameters permitted by our setup to illustrate the consistency of the proposed
metric stated in Eq. (
2
) for quantifying LBO proximity.
It is observed that
Here, we
first presents the variation of
γ
Φ
LBO
is dependent on L
fuel
, i.e., the degree of premixing. In
order to explore the applicability of our predictor for various degrees of premixing,
we conducted different tests for a wide range of air
fl
ow rates and L
fuel
permitted by
the setup. The color ratio, i.e.,
, was determined for each decreasing equivalence
ratio condition and reported over a normalized equivalence ratio (
γ
Φ
/
Φ
LBO
)in
Search WWH ::

Custom Search