Biomedical Engineering Reference
In-Depth Information
−⋅ −⋅
qt
β
t
N
⋅− ⋅
(1
e
)
e
if
0
≤ <
t
t
∞
0
(7.1)
Nt
()
=
Nt
()
0
=
N
if
t
≤
<
t
0
0
0
if
t
0
Although
N
(
t
) is the total count of singular particles on the bottom,
q
represents
the increase in particles per unit time, and b stands for the overlap of particles.
N
∞
describes the fictive, calculable number of all sedimented particles for the case that
no overlapping occurs (b = 0), whereas
N
0
gives the countable number of particles
at the end of the sedimentation process at time
t
0
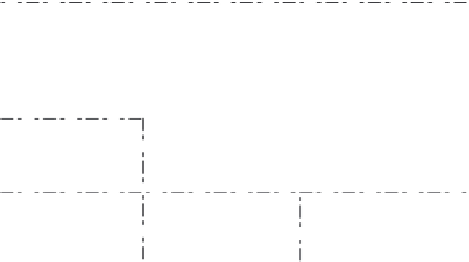
. The kinetic sedimentation model
(based on Equation 7.1) is illustrated in Figure 7.2 which shows two virtual border
case components
N
q
(
t
) and
N
b
(
t
): Although
N
q
(
t
) represents the sedimentation of par-
ticles without any particle overlap,
N
b
(
t
) comprises a certain degree of overlap lead-
ing to optically merged particles and to an apparently lower number of particles (see
Figure 7.3 for definition of
N∞
,
N
0
, and
N*
and associated
t
-values). A realistic sce-
nario certainly depends on particle concentration and is expected to lie between both
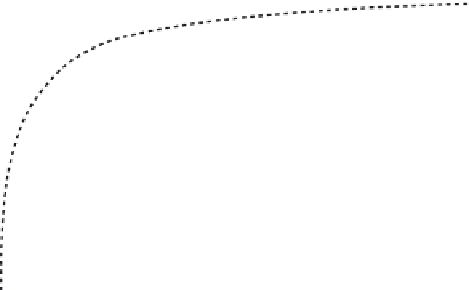
curves. Figure 7.3 shows the settling of agglomerated AlOOH nanoparticles. The
measured number of sedimented particles can also be described by a modeled curve
(dotted line) from which a deviation of less than 2% was obtained. The accuracy of
the sedimentation model was evaluated by fitting it to the measured values of several
sedimentation experiments. We discovered that the sedimentation parameters
N
0
,
N
∞
,
q
, and β were normally distributed; the maximum deviation from the particular
parameter average value was approximately 5%.
N
∞
N
+
N
q
(
t
)
N
b
′
(
t
)
N
*
N
b
(
t
)
N
0
N
0
(
t
>
t
0
)
t
0
t
*
t
0
T
FIGURE 7.2
Limit cases of the kinetic sedimentation model. The quantity of virtually
sedimented particles
N
at the bottom is shown as a function of time
t
(0
≤ t ≤ T
)
.
The upper
curve
N
q
(
t
) shows the virtual situation without overlapping particles (b = 0); particle numbers
converge against the maximum value
N
∞
. The lower curves
N
b
(
t
) and
N
b¢
(
t
) show what hap-
pens to particle numbers in case that particles overlap (0 < b¢
<
b
)
. At low overlap (b¢) a
pseudo-plateau value of
N
+
occurs; at a marked overlap, a maximum number
N*
is reached
at
t*
,
whereas the final value
N
0
(when the sedimentation process is finished) is lower and is
reached at time
t
0
.


Search WWH ::

Custom Search