Biomedical Engineering Reference
In-Depth Information
2 µm
2 µm
(a)
(d)
2 µm
2 µm
(b)
(e)
Particle size distribution
Particle size distribution
7
5
4.5
3.5
2.5
1.5
0.5
6
5
4
3
2
1
0.01
4
3
2
1
0.01
0.1
1 10
Particle size (µm)
100
1000 3000
0.1
1
10
100
1000 3000
(c)
(f)
Particle size (µm)
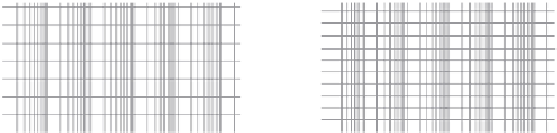
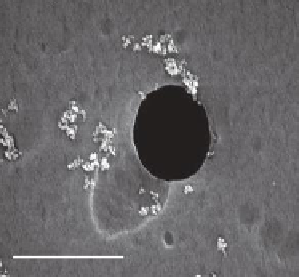
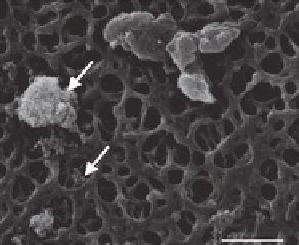
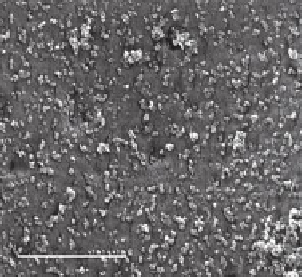
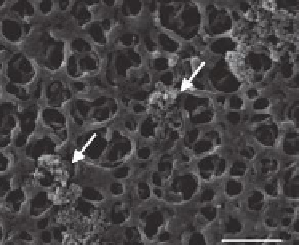
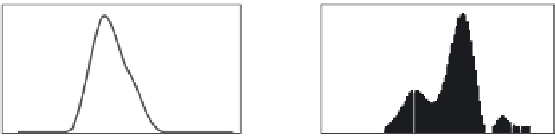
FIGURE 7.1
Structure of nanoparticles used for sedimentation and cell culture experiments.
(a-c) AlOOH nanoparticles, (d-f) CeO
2
nanoparticles. Nanoparticles were dispersed by ultra-
sonication in H
2
O and spread on Teflon®
®
filters with a pore size of 1 µm (a: AlOOH, d: CeO
2
).
Typical agglomerates (arrows) as formed in cell culture medium were enriched on a polycar-
bonate filter with a pore size of 0.22 µm (b: AlOOH, e: CeO
2
). Size distribution histograms of
particle size in cell culture medium (Malvern Mastersizer) reveal that smallest particles are
in the range of 0.3 µm for both AlOOH (c) and CeO
2
(f ).
particle count
N
(
t
) at the bottom of the culture vessel. These simulations showed
that
N
(
t
) increased rapidly in the beginning until the rising number of particles led
to a partial overlap. Consequently, the increase in
N
(
t
) was attenuated or, later on,
even decreased, whereas both the apparent mean size of particles and the total area
covered by particles increased continuously. The kinetic sedimentation is described
by the following equation:


Search WWH ::

Custom Search