Biomedical Engineering Reference
In-Depth Information
35
60
30
50
25
40
20
30
15
20
10
10
5
0
1
0
13
26
38
51 63
Time (t) [min]
76
88
101
113
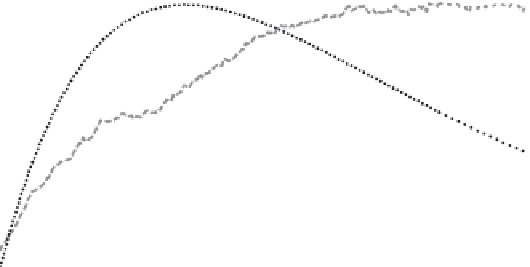
FIGURE 7.3
Sedimentation of agglomerated AlOOH nanoparticles and approximation by
modeled data. Gray curve ( ) shows measured values of
N
, dotted curve ( ) shows
data from the model, and dashed curve ( ) gives the total pixel area covered by particles,
covered area pixel) in dependency of time
t
. The model parameters
N
0
,
N
∞
,
q
,
and b were
estimated by least-square approximation with
q
= 0.00495/min; b = 0.0117/min;
N
0
= 25673;
N
∞
= 75267; and
t
0
= 77 min. The AlOOH suspension contained 180 µg/mL; the smallest
recognized particle size was 1 pixel.
7.3.1.2 Conversion of Measured Particle Size into Particle Mass
The precision of the sedimentation model allowed us to predict the number of sedi-
mented particles per area at each point in time during an ongoing sedimentation pro-
cess. Provided that the initial concentration of particles is known and the complete
particle mass underwent gravitational settling, the mass per particle agglomerate
could be calculated. At this point, however, the overlap of particle agglomerates
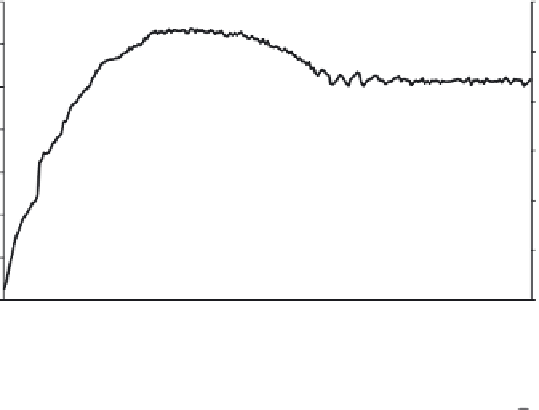
becomes an issue and has to be corrected for: In Figure 7.4 (upper curve) the increase
in particle-covered area is shown for the virtual case that an overlap does not occur
(this can be implemented in the model). Then a conventional simulation with overlap-
ping particles was carried out, which better reflects a real situation. Particle-covered
areas were determined for both cases and the degree of particle overlap (
µ
0
) was cal-
culated. Figure 7.4 shows that the value for
µ
0
was ca. 28% (with a standard deviation
of 0.6%), if the particle-covered area amounts to 40%. In other words, the true area
which would have been covered by all sedimented particles is underestimated by
28% due to particle overlap. We further varied size (and shape) of the simulated par-
ticles from 0.1 to 3-fold the size of real AlOOH or CeO
2
nanoparticle agglomerates
(assuming a particle diameter of 1.2 µm) and found no significant effect on
µ
0
, which
remained at 28% (at 40% particle-covered area). However, a massive increase in
particle size to 400 µm increased
µ
0
up to 55% (at 10% particle-covered area). These
examples show that the particle overlap
µ
0
can be retrieved from modeled data, and
that
µ
0
needs to be considered (and corrected for) if the measured particle-covered
area is converted into real values or particle mass, respectively.


Search WWH ::

Custom Search