Abstract
Most recent category-level object recognition systems work with visual words, i.e. vector quantized local descriptors. These visual vocabularies are usually constructed by using a single method such as ^-means for clustering the descriptor vectors of patches sampled either densely or sparsely from a set of training images. Instead, in this paper we propose a novel methodology for building efficient codebooks for visual recognition using clustering aggregation techniques: the Visual Word Aggregation (VWA). Our aim is threefold: to increase the stability of the visual vocabulary construction process; to increase the image classification rate; and also to automatically determine the size of the visual codebook. Results on image classification are presented on the testbed PASCAL VOC Challenge 2007.
Keywords: clustering aggregation; visual words; object recognition.
Introduction
A popular strategy for representing images within the context of category-level object recognition is the Bag-of-Words (BoW) approach [3]. The basic idea behind this type of representation is to characterize an image by the histogram of its visual words, i.e. vector quantized local features (see Figure 1). Popular candidates for these local features are local descriptors [12] that can be extracted at specific interest points [3], densely sampled over the image [7], or via a hybrid scheme called dense interest points [18]. There are various clustering methods for creating these visual words. ^-means or variants thereof, such as approximate ^-means [15] or vocabulary trees [14], are currently the most common.
Subsequently, each local feature in an image is mapped to a cluster so as to represent any image as a histogram over the clusters. The BoW representation has been shown to characterize the images and objects within them in a robust yet descriptive manner, in spite of the fact that it ignores the spatial configuration between visual words. Moreover, variations on these BoW models have shown impressive results lately [17], wining the PASCAL Visual Object Classes Challenge on object classification.
Although such ideas appear to be quite exciting, there are 2 main challenges that need to be overcome. Since the clustering into visual words is unsupervised, this representation does not group semantically meaningful object parts (e.g. wheels or eyes). In practice, if the dataset is sufficiently coherent (e.g. images of only one particular class), only a reduced number of visual words represent semantic object parts. Moreover, when an unsupervised quantization is applied to a more diverse dataset, synonyms and polysemies are the norm rather than the exception [16].
Fig. 1. BoW approach overview. It starts with the extraction of local features followed by robust description of the features, e.g. using SIFT [11]. The following step consists in vector quantizing the high dimensional space of local image descriptors to obtain a visual vocabulary. A BoW is then built as a histogram of visual word occurrences.
On the other hand, there are the limitations of the clustering algorithms themselves. In general, data clustering usually has associated the stability problem: it is not possible to use cross validation for tuning the clustering parameters because of the absence of ground truth; the dependence on the initialization is a common problem for most of the iterative methods; the objectives pursued by each clustering approach are different and different structures in data may be discovered.
Specifically, K-means clustering output depends on the initialization as the procedure only undertakes the search for a local optimum and it requires the user to specify the number of clusters. Furthermore, it is computationally expensive for big values of K. Other approaches use efficient hierarchical clustering schemes (e.g. [9]) where one fixes a cut-off threshold on the cluster compactness. It may happen that some real clusters are split in several clusters, so that the visual words are not representative of all features. Furthermore, run-time and memory requirements are often significantly higher for these hierarchical methods.
Several attempts have been made to create efficient codebooks for visual recognition. There are some unsupervised approaches based on frequent itemset mining (e.g. [20]). Typically, finding representative visual words boils down to finding frequent co-occurring groups of descriptors in a transaction database obtained from the training images. Some supervised approaches use image annotation and class labels to guide the semantic visual vocabulary construction (e.g. [13,10]).
In this paper, we introduce a new methodology to obtain efficient visual words with a threefold objective: to overcome the problem of clustering stability; to increase the image classification rate; and also to automatically determine the size of the visual codebook. We propose to adapt the clustering aggregation techniques described in [6] to the visual vocabulary construction process. To the best of our knowledge, this is the first paper to describe such a clustering aggregation based approach within this context. We analyze how these techniques perform in discovering visual words using different combinations of quantization algorithms.
The rest of this paper is organized as follows. In Section 2 we introduce the clustering aggregation theory. Section 3 gives a detailed description of the novel approach we propose to adapt the clustering aggregation techniques to the visual vocabulary construction process. Experiments in image categorization are described in Section 4 and Section 5 concludes the paper.
Clustering Aggregation
The problem of clustering aggregation has been considered under a variety of names: consensus clustering, clustering combination and cluster ensembles. Many approaches have been proposed (e.g. the graph cut method [5] and the Bayesian method [19]).
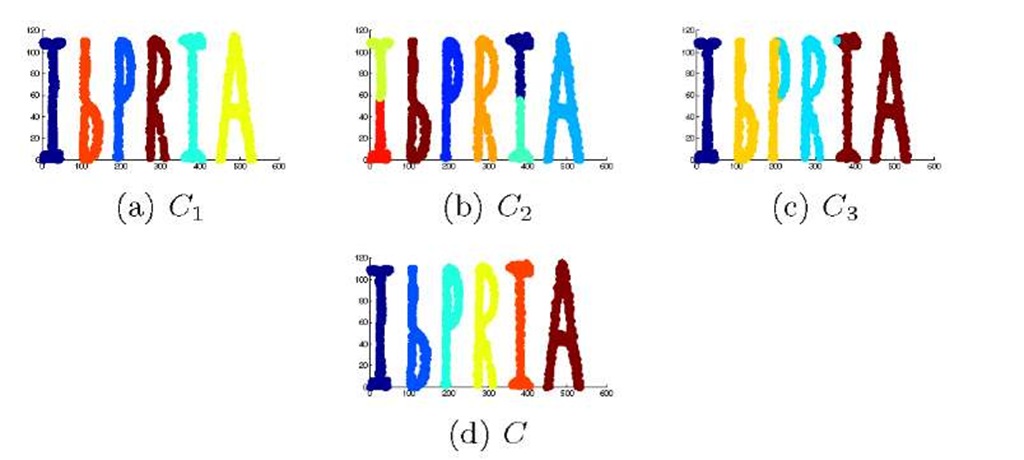
In [6], clustering aggregation is defined as an optimization problem where, given a set of m clusterings, the objective is to find the clustering that minimizes the total number of disagreements with the m clusterings. Clustering aggregation can be considered as a metaclustering method to improve stability and robustness of clustering by combining the results of many clusterings. Moreover, it can determine the appropriate number of clusters while detecting outliers. A toy example to illustrate how the clustering aggregation works is depicted in Figure 2.
Fig. 2. Toy example. (a)-(c) are 3 different clusterings {C1 ,C2 ,C3} over the IbPRIA dataset of 2D points. (d) depicts the result of the clustering aggregation algorithm, the clustering C. Note that the solution C improves the clustering robustness and finds the 6 clusters in the IbPRIA dataset. We have used different colors to denote different clusters.
Gionis et al. [6] propose an approach to this problem based on correlation clustering techniques [1]. We are given a set of m clusterings {Ci, C2,…, Cm}. Our objective is to obtain a single clustering C that agrees as much as possible with the m input clusterings. It is possible to define a distance d(u,v) between two vectors u and v as the fraction of the m clusterings that place u and v in different clusters. Our objective is to find a clustering C that minimizes the function![]() where C(v) de
where C(v) de
notes the label of the cluster to which v belongs to. In the experiments we have used the Balls and the Agglomerative (Agg) algorithms described in [6]. Both algorithms take as input a complete graph with all the distances between vectors. The Balls algorithm tries to find groups of nodes that are within a ball of fixed radius and far from other nodes. Once such a set is found, the algorithm considers it a new cluster and proceeds with the rest. The Agg is a bottom-up algorithm which starts with every node in a cluster. It merges two vertices if the average distance between them is less than a fixed value.
Visual Word Aggregation
In this work we propose to analyze how clustering aggregation algorithms work for building efficient visual vocabularies. We propose a novel BoW approach via Visual Word Aggregation (VWA). Our aim with this approach is threefold: to increase the stability of the codebook construction process, to automatically determine the size of the vocabulary, and to obtain better results in categorization. Figure 3 depicts the major steps of our proposal. In the first step, images are represented using local features (e.g. SIFT [11]). Then, the vector quantization processes start. We define m as the number of clustering algorithms that are executed, i.e. m is the number of codebooks. Different quantization algorithms and/or several executions of the same algorithm can be used. The VWA uses these m initial codebooks to build the vocabulary to be used in the BoW approach.
Fig. 3. Flowchart of our novel approach for image classification via VWA
However, a direct application of the clustering aggregation algorithms in [6] to the m codebooks is not feasible. Every clustering defines a vocabulary that organizes the local descriptors in a high dimensional space (e.g. 128 dimensions for SIFT descriptors). Furthermore, thousands of descriptors are extracted from each image, so we have to deal with large datasets of vectors, where the number of clusters is high too. The algorithms described in [6] take the distance matrix as input so their complexity is quadratic in the number of data objects in the dataset, which makes them inapplicable to large datasets. Gionis et al. [6] presented a sampling algorithm to overcome this problem. In a preprocessing step, their algorithm samples a set of nodes S uniformly at random from the dataset. The set S is the input for the clustering aggregation algorithm. In the postprocessing step, the algorithm goes through the nodes not in S and decides whether to place it on one of the existing clusters or to create a singleton. Nonetheless, we observed experimentally that the time complexity of their approach is high within our context, i.e. when the number of clusters and the dimensionality of vectors are high.
In order to reduce the run-time of the visual vocabulary construction, we define a new sampling strategy. Let O be the dataset of local descriptors of size N, O = {vi, v2,…, vN}. We start with a uniform and random sample R C O of size M = f3N, where f3 G [0,1] is the sampling factor. As in [6], the set R is sampled to obtain the subset S C R. The set S is given as input to the clustering aggregation algorithm which builds a clustering C = {c1, c2,…,cK}. Note that with our sampling scheme, the postprocessing step only needs to evaluate the elements in R and not in S, which significantly reduces the run-time of the original approach. Finally, we inspect the vectors in O and not in R and assign them to the nearest cluster. Using this double sampling strategy we can handle large datasets letting VWA converge into a final codebook.
Results
Experimental Setup. Our aim is to evaluate, within the context of image classification, the performance of the VWA approach. So as to obtain reliable results, we use the PASCAL VOC Challenge 2007 database [4]. This challenge is widely acknowledged as a difficult testbed for both object detection and image categorization. We select the trainval and test set for training and testing the classifier respectively. See [4] for further details.
For image representation, we use SIFT [11] descriptors of 16 x 16 pixel patches computed over a grid with spacing of 8 pixels. With these descriptors we perform the vocabulary construction via VWA. Specifically, we use our own implementations of the ^-means and the Jurie and Triggs (J&T) [7] clustering algorithms. In the clustering aggregation step we integrate our novel sampling methodology with the Balls and the Agg algorithms [6].
Support Vector Machines (SVMs) are used for classification. We experiment with the Histogram Intersection Kernel (HIK) which has shown good results in object recognition [8]. The HIK applied to two feature vectors x and x’ of dimension d is defined as k(x, x’) = ^d=1 min(x(i), x’(i)). Specifically, we use libSVM [2]. A 10-fold cross-validation on the trainval set to tune SVM parameters is conducted to train each classifier. We follow the image classification evaluation procedure proposed by the PASCAL VOC Challenge [4] using the Mean Average Precision (MAP), which is computed by taking the mean of the average precisions for the 20 classes for each method.
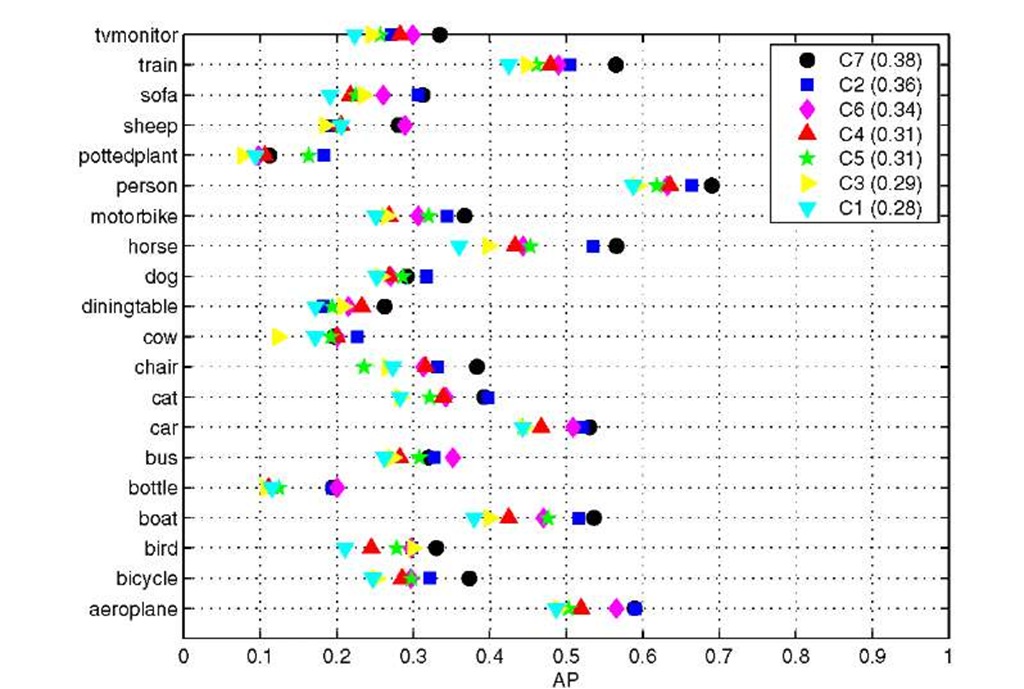
Codebooks performance in image classification. We evaluate the MAP in image categorization for the codebooks described in Table 1. Note that code-books C1 and C4 have been obtained without using the VWA approach, i.e. following a traditional BoW approach. Results per object category are shown in Figure 4.
Table 1. Codebooks obtained for the experiments in image classification
Fig. 4. Evaluation of codebooks on image categorization over the PASCAL VOC 2007 Challenge. Average precision per class for each method is shown.
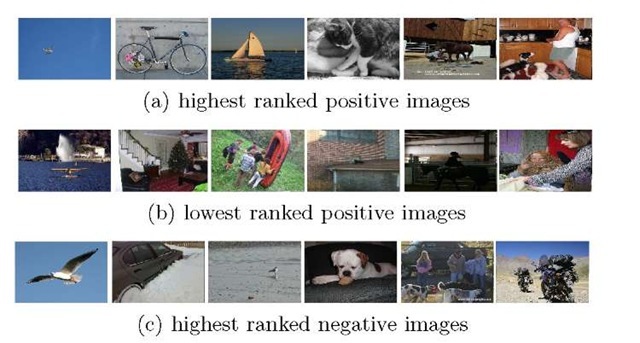
The aggregation of 1 K-means and 1 J&T, i.e. codebook C7, obtains the best MAP (0.38). Furthermore, all the codebooks generated via VWA using the Balls algorithm and our sampling approach (vocabularies C2, C5, C6 and C7), obtain better results than when a traditional BoW is used (C1 and C4). Comparing C2 and C3 we also have observed that the Balls algorithm performs better than the Agg. Moreover, for the Balls algorithm, we have found that a < 0.25 leads to better results in image categorization. We observed experimentally that the sampling factor 3 directly affects to the classification performance: the best results are obtained for 3 > 0.5. Finally, Figure 5 shows ranked images for 4 different classes.
Discussion. Results confirm that the VWA technique can be used to obtain better vocabularies. It is also useful for large sets of vectors in high-dimensional spaces. Such spaces are sparse with the data points far away from each other.
Fig. 5. Ranked images for the classes aeroplane, bicycle, boat, cat, horse and person. (a) positive images assigned the highest rank. (b) positive images assigned the lowest rank. (c) negative images assigned the highest rank, i.e. images which confuse the classifiers.
Furthermore, all pairwise distances in a high-dimensional data set seem to be very similar. The phenomenon is known in the statistical literature as the curse of dimensionality. This may lead to problems when searching for clusters. K-means is a popular algorithm for its simplicity. Unfortunately, centers tend to be tightly clustered near dense regions and sparsely spread in sparse ones. The J&T [7] is a mean-shift based approach that can be used to overcome some of the limitations of K-means. The VWA technique can be used to combine the properties of K-means and J&T clustering algorithms to obtain better visual vocabularies.
Conclusion
We have introduced the VWA methodology which incorporates the clustering aggregation techniques to the visual codebook construction process. To the best of our knowledge, this is the first paper to describe such a clustering aggregation based methodology within this context. Also, a novel sampling strategy has been designed in order to use the VWA approach with large sets of vectors in high dimensional spaces. Results show that the MAP increases when the vocabularies are obtained via VWA. Exploring other clusterings as well as other datasets is one interesting avenue of future research.
![BoW approach overview. It starts with the extraction of local features followed by robust description of the features, e.g. using SIFT [11]. The following step consists in vector quantizing the high dimensional space of local image descriptors to obtain a visual vocabulary. A BoW is then built as a histogram of visual word occurrences. BoW approach overview. It starts with the extraction of local features followed by robust description of the features, e.g. using SIFT [11]. The following step consists in vector quantizing the high dimensional space of local image descriptors to obtain a visual vocabulary. A BoW is then built as a histogram of visual word occurrences.](http://what-when-how.com/wp-content/uploads/2011/07/tmp9F5107_thumb_thumb.jpg)


