The Ramachandran plot is a two-dimensional graph of the phi (f) and psi (y) backbone angles for each amino acid residue of a protein; it is a simple method of assessing the quality of a protein structure. It is named after G. N. Ramachandran, who first determined the values of f and y that are theoretically permitted (1). The symbols f and y are used to represent the dihedral angles of the backbone N-Ca; and Ca;-C bonds, respectively (Fig. 1). Omega (w) is the angle of the peptide bond, C-N, but this bond has partial double bond character, so w can only adopt values close to 180° (called trans) or 0° (cis). Of these two, the trans peptide w conformation is observed in most cases, unless the following residue is proline (see Cis/Trans Isomerization).
Figure 1. Section of a polypeptide chain showing two peptide bonds (-CONH-) and one amino acid residue (-NH-Ca; (R)(H)-CO-). The functional group R varies, depending on the type of amino acid. The dihedral angles w, f and y of the peptide backbone are labeled.
The bonds represented by f and y are single bonds, and in principle all bond rotations are feasible. Only certain combinations of the backbone angles f/y are possible in polypeptide chains, however, due to steric restraints imposed by the amino acid side chains. These are defined as the most favorable or "allowed" regions of the Ramachandran plot, and they include the conformations of regular secondary structure such as a-helix or b-strand. In general, the f angle only adopts negative values. Of the 20 natural amino acids, 18 have only slightly differing allowed values of f and y. The glycine residue, with only a hydrogen for its side chain, has a high degree of backbone conformational flexibility and can adopt f/y angles that are forbidden for other amino acid residues (positive f angles, for example). In contrast, the cyclic nature of the proline residue restricts its value of f to approximately -60°.
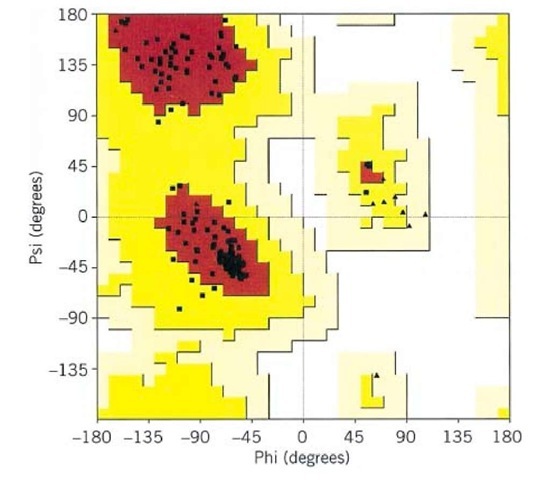
The residues in natural folded proteins generally adopt fully allowed values of f and y; exceptions usually have functional importance. Generally, over 90% of nonglycine amino acid residues in a protein structure have backbone conformations corresponding to the a, b, or turn types of secondary structure. This can be visualized using plots of the observed f/y combinations for each residue of a protein structure (Fig. 2). The Ramachandran plot is a very useful means of assessing the quality of a protein structure and of identifying residues with unusual backbone conformations.
Figure 2. Ramachandran plot for a typical protein structure. The f/y values of each nonglycine residue are plotted as squares, and those for glycine residues are shown as triangles. The allowed or most favored regions of the Ramachandran plot are shown in red. The top left section corresponds to b-strand secondary structure, the middle left section corresponds to a-helix and the small middle right section corresponds to left-handed helix. Over 90% of the nonglycine residues fall within the most favored (red) regions of the Ramachandran plot. Additional allowed regions are shown in varying shades of yellow.


