Enzymes that conform to Michaelis-Menten kinetics yield plots of initial velocity v, as a function of substrate concentration A that are rectangular hyperbolas of the form
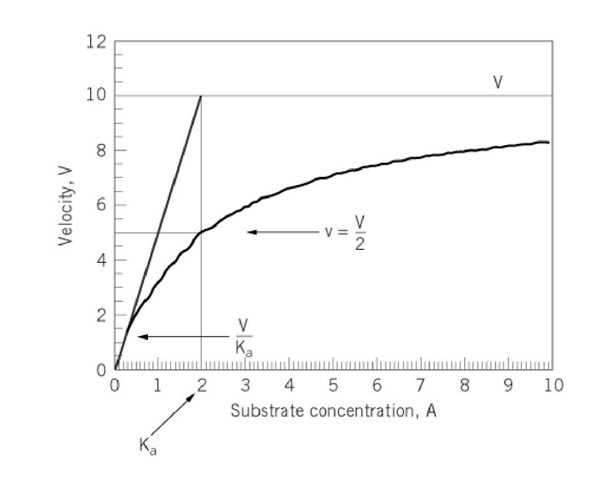
where Ka denotes the Km (Michaelis constant) for substrate A and V is the maximum velocity of the reaction. Hyperbolas of this type pass through the origin with an initial slope of V/Ka and have an asymptote, where v = V (Fig. 1). The determination of values for V and Ka from a hyperbolic curve is difficult, especially as the asymptote cannot be well defined and error will always be associated with initial velocity data. To overcome this difficulty, the equation was rearranged to linear forms to permit the graphical determination of values for the kinetic parameters. The first of the linearizations was reported by Lineweaver and Burk (1). Subsequently, two other linearizations were suggested; one was advanced by Eadie (2) and Hofstee (3) (see Eadie-Hofstee Plot) and the other by Hanes (4).
Figure 1. Variation of initial velocity v as a function of the concentration of substrate A as described by Equation 1.
The Lineweaver-Burk rearrangement of the initial velocity equation involves taking reciprocals of each side of the equation and rearranging:
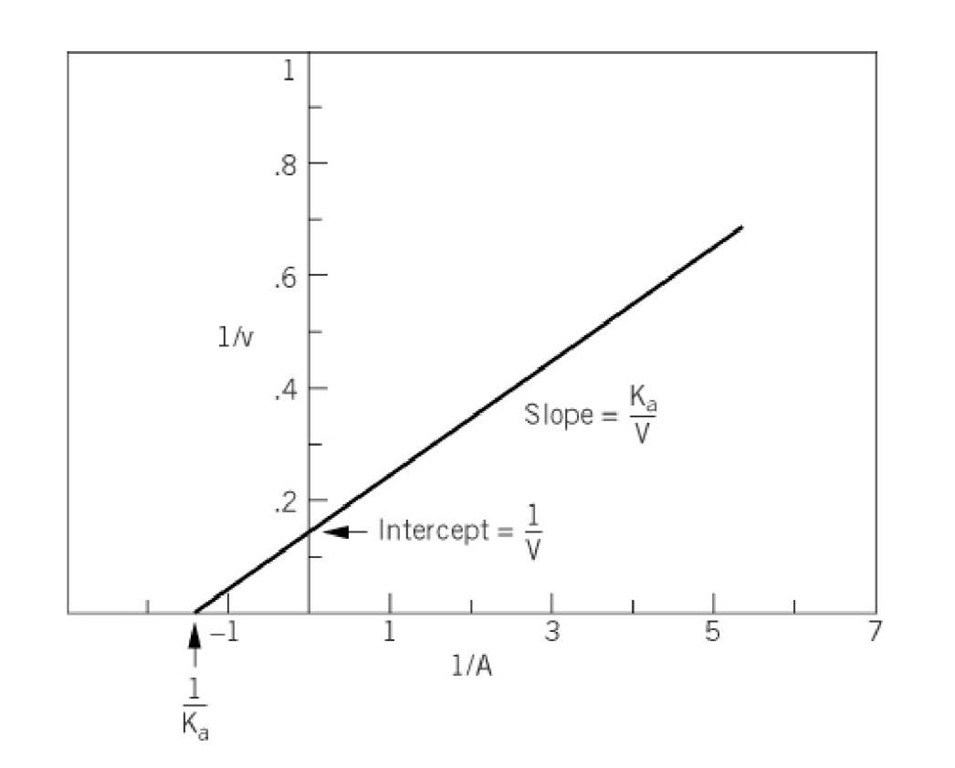
A plot of 1/v against 1/A yields a straight line, with a slope of KJV and an intercept with the vertical ordinate of 1/V (Fig. 2). The intersection of the line with the abscissa occurs at the point where 1/v = 0 and at this point -1/A = 1/Kfl.
Figure 2. Double-reciprocal plot of the variation of the initial velocity v of an enzyme-catalyzed reaction as a function of substrate concentration A.
Determinations of values for the kinetic parameters for a two-substrate reaction are more complex. This can be illustrated by reference to the initial velocity equation for a sequential Bi-Bi reaction that conforms to Michaelis-Menten kinetics involving random binding of substrates A and B to the enzyme, to form a ternary EAB complex (Eq. 3):
where Ka and Kb are the dissociation constants for the dissociation of each substrate from the ternary EAB complex and Kia is the dissociation constant of the EA complex. The reciprocal form of this equation is given by Equation 4:
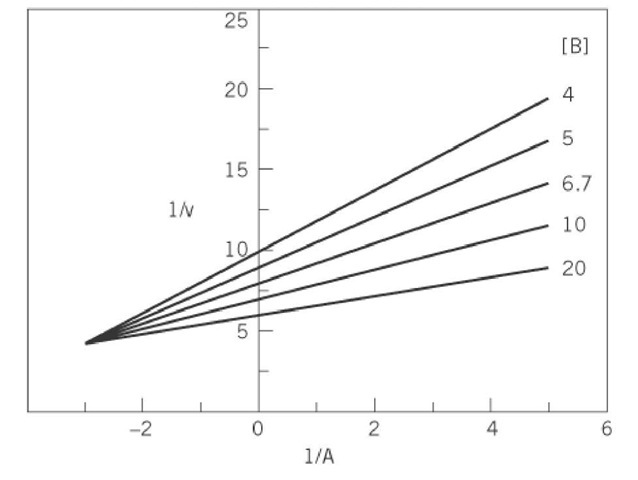
For a plot of 1/v against 1/A, Equation (4) is that of a straight line with both slope and intercept varying as a function of the concentration of substrate B. Data obtained for the variation of the initial velocity as a function of the concentration of A, at different fixed concentrations of B, would give a family of straight lines that intersect at a point to the left of the vertical ordinate (Fig. 3), where the 1/v and 1/A coordinates are![]() , respectively. Thus, the crossover point may be above, on, or below the abscissa, depending on the relative values of Ka and Kia. The intersection of each straight line with the abscissa would give only an apparent value for Ka at a particular concentration of B. The slope of the lines as a function of B is described by Equation (5):
, respectively. Thus, the crossover point may be above, on, or below the abscissa, depending on the relative values of Ka and Kia. The intersection of each straight line with the abscissa would give only an apparent value for Ka at a particular concentration of B. The slope of the lines as a function of B is described by Equation (5):
so that a replot of the slopes of the lines of the primary plot against 1/B would yield a straight line that intersects the abscissa at a point equal to For a rapid-equilibrium random mechanism, this value is equal to Kib, the dissociation constant for the interaction of B with free enzyme. For an ordered mechanism, there is no EB complex. The intersection points of the lines of the primary plot with the vertical ordinate give only apparent maximum velocities at different fixed concentrations of substrate B. Variation of the intercepts with the concentration of B is described Equation (6):
so that a replot of the intercepts of the primary plot against 1/B would be a straight line that intersects the vertical ordinate at the reciprocal of the true value for the maximum velocity and the abscissa at the reciprocal of the true value for Kb. Values for V, Kja, and Ka would be obtained in a similar manner by starting with a plot of 1/v against 1/B at different fixed concentrations of A.
Figure 3. Double-reciprocal plot of the variation of the initial velocity of an enzyme-catalyzed reaction involving the sequential addition of two substrates, A and B, as a function of the concentration of substrate A at different fixed concentrations of substrate B.
There has been considerable discussion in the past about the relative merits of the Lineweaver-Burk plot, the Eadie-Hofstee plot, and Hanes linearization procedures for obtaining the best estimates of values for kinetic parameters (3, 5). Those days have long since passed, and now computer programs are available for least-squares fitting of data, with appropriate weighting factors, to an assumed rate equation (6). Graphical methods are important for determining the form of the rate equation to which the data are to be fitted and for illustrating the results of kinetic investigations. The Lineweaver-Burk plot must be considered the most satisfactory of the three types of plot, as it shows the straightforward variation of one dependent variable as a function of the concentration of one or two independent variables.


![tmp14F-46_thumb[1] tmp14F-46_thumb[1]](http://what-when-how.com/wp-content/uploads/2011/05/tmp14F46_thumb1_thumb.jpg)
![tmp14F-47_thumb[1] tmp14F-47_thumb[1]](http://what-when-how.com/wp-content/uploads/2011/05/tmp14F47_thumb1_thumb.jpg)

