1. Genome compartmentalization
Thirty years ago, we discovered that the bovine genome (neglecting satellite DNAs, which consist of tandemly repeated short sequences) was made of DNA molecules (about 30 kb in size in our work) of fairly uniform GC levels (GC is the molar percentage of guanine+cytosine in DNA). These DNA molecules belonged to a small number of families that covered a wide GC range (Filipski etal., 1973). Indeed, each family was comparable in compositional heterogeneity to prokaryotic genomes, the least heterogeneous genomes of living organisms. This was the first evidence that a mammalian genome was a mosaic of DNA segments belonging to different compositional families.
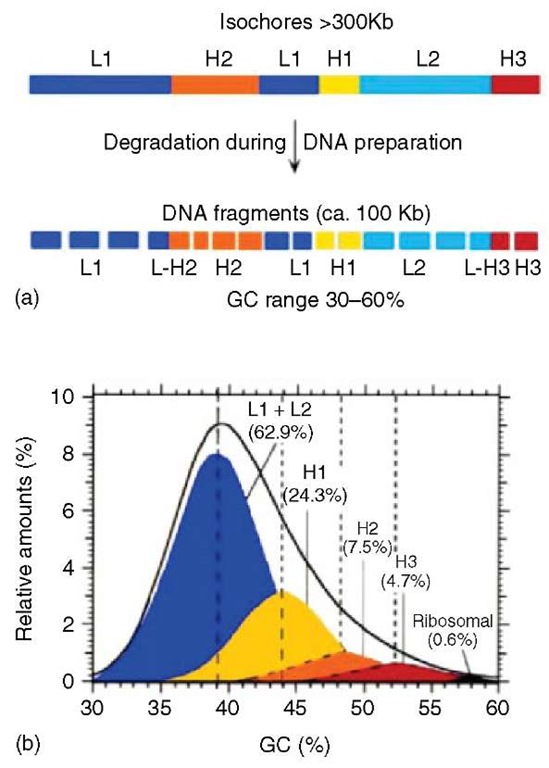
These initial observations were quickly extended to other vertebrates. The genomes of warm-blooded vertebrates essentially showed the compositional features just described for the bovine genome (Thiery etal., 1976). For example, in the human genome, five families of DNA molecules (neglecting satellite and ribosomal DNA) were identified and physically separated from each other. They were called L1, L2, H1, H2, and H3, in order of increasing GC level; the first three families comprised about 88% of DNA, the last two only about 12% (see Figure 1).
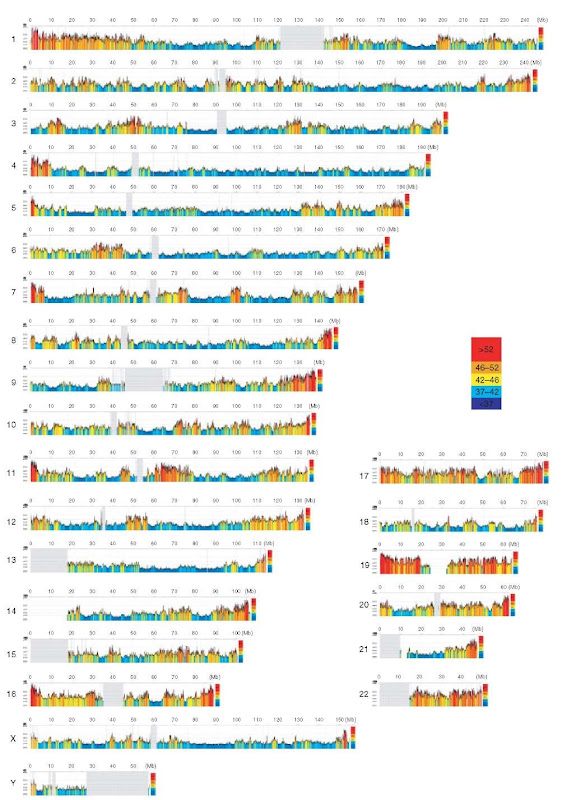
Further, investigations showed that the DNA molecules derived from much larger, fairly homogeneous DNA regions (at least 300kb in size; Macaya etal., 1976), which were called isochores (for compositionally equal regions). The existence and the features of isochores were confirmed and visualized 25 years later (Pavlicek et al., 2002) using the draft sequence of the human genome as soon as it became available (Lander et al., 2001; Venter et al., 2001; see Figure 2).
2. Genome phenotypes
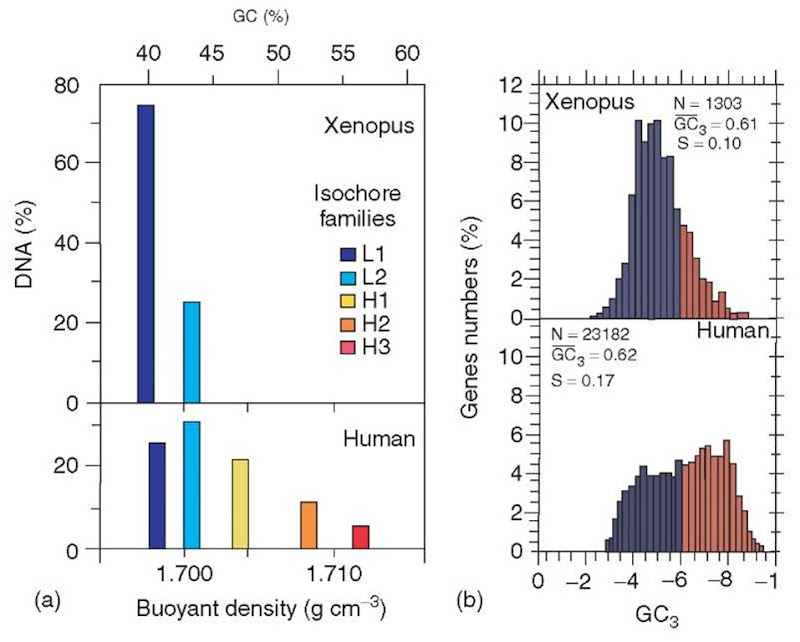
In contrast to warm-blooded vertebrates, cold-blooded vertebrates showed a less striking heterogeneity, because their GC-richest isochores were not as GC-rich as in warm-blooded vertebrates (Figure 3). Most interestingly, the of the genomes of vertebrates are mimicked by the compositional patterns of coding sequences (that only represent 1-2% of the genomes in most vertebrates). Both compositional patterns amount to “genome phenotypes” (see Figure 3). This is a new concept compared to the “classical phenotype”, which is represented by form and function, or, in molecular terms, by proteins and their expression.compositional patterns
Figure 1 (a) Scheme of the isochore organization of the human genome. This genome, which is typical of the genome of most mammals, is a mosaic of large DNA segments, the isochores, which are compositionally fairly homogeneous and can be partitioned into a small number of families, light, or GC-poor (L1 and L2), and heavy, or GC-rich (H1, H2, and H3). Isochores are degraded during DNA preparation to fragments of 50-100kb in size. The GC range of these DNA molecules from the human genome is extremely broad, 30 to 60%. (Reprinted with permission from the Annual Reviews of Genetics, Volume 29. Copyright 1995 by Annual Reviews www.annualreviews.org). (b) The CsCl profile of human DNA is resolved into its major DNA components, namely, DNA fragments derived from each one of the isochore families (L1, L2, H1, H2, and H3). Modal GC levels of isochore families are indicated on the abscissa (broken vertical lines). The relative amounts of major DNA components are indicated. Satellite DNAs (which form only a very few percent of the human genome) are not represented.
It is important to note that an isochore organization of the genome is not limited to vertebrates, but is very widespread in eukaryotes, being also found in plants, insects, trypanosomes, and so on (see Bernardi, 2004).
Figure 2 A color-coded compositional map of human chromosomes, representing 100kb moving window plots that scan the human genome sequence. Color codes span the spectrum of GC levels in five steps, from ultramarine blue (GC-poorest isochores) to scarlet red (GC-richest isochores). Gray vertical lines correspond to the gaps present in the euchromatic part of the chromosomes.
Figure 3 (a) Isochore families from Xenopus and human, as deduced from density gradient centrifugation. (b) Compositional patterns of coding sequences (represented by GC3 values averaged per coding sequence; GC3 is the GC level of third codon positions) for Xenopus and human.
3. The genomic code
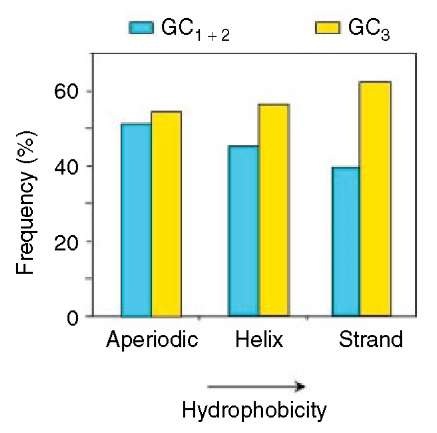
An obvious question is whether there is any correlation between the composition of coding and contiguous noncoding sequences. The answer is positive. Indeed, GC-rich coding sequences are flanked by GC-rich noncoding sequences, whereas GC-poor coding sequences are flanked by GC-poor noncoding sequences (Figure 4a). In fact, the genomic code (as these correlations were called) extends further, since compositional correlations also hold between exons and introns (Figure 4b) and among codon positions (see Figure 4c), the latter being valid from prokaryotes to mammals and being, therefore, called universal correlations (D’Onofrio and Bernardi, 1992). Finally, correlations also exist between the composition of coding sequences and the hydrophobicity and secondary structure (aperiodic, helix, strand) of the encoded proteins (Figure 5).
It should be stressed that the genomic code provided the first evidence for the eukaryotic genome being an integrated ensemble. One could also say that the genomic code has shown, to paraphrase Galileo, that the topic of the genome is written in a mathematical language. Obviously, the genomic code cannot be reconciled with the idea of noncoding sequences being “junk DNA” (Ohno, 1972) and with the idea that “repeated sequences” like Alus and LINEs are “selfish DNAs” (Doolittle and Sapienza, 1980; Orgel and Crick, 1980). Indeed, if the base composition of coding sequences is under selection for thermal stability (see Bernardi, 2004), so must be noncoding sequences, since their composition is correlated with that of coding sequences.
Figure 4 (a) Correlations between GC3 of human genes and the GC level of DNA fractions or YACs (Yeast Artificial Chromosomes) in which the genes were localized (filled circles), or of 3′ flanking sequences (open circles; from Zoubak et al., 1996). (b) Correlations between GC levels of human coding sequences (CDS) and of the corresponding introns (Modified from Clay et al., 1996). (c) Correlations between GC3 and GC1 or GC2 for 20 148 human genes
Figure 5 Histogram of the frequencies of GC3 and GC1+2 in the three secondary structures of the proteins, which were ordered according to increasing hydrophobicity
4. Gene distribution in isochores and chromosomes
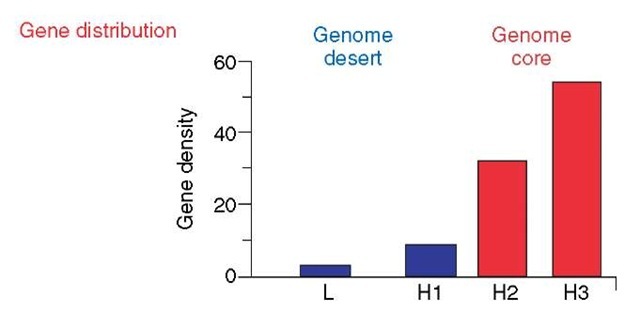
Two most important properties of vertebrates (as well as of other eukaryotes) concern the distribution of genes in the genome and in chromosomes and the correlations of such gene distributions with other structural and functional properties (Figure 6). The first indication that gene distribution was strikingly nonuniform (in contrast with the then current views) was published 20 years ago (Bernardi et al., 1985). Further work (Mouchiroud et al., 1991; Zoubak et al., 1996) identified two gene spaces, a genome core (the GC-rich isochore families H2 and H3) characterized by a high gene density and a genome desert (the GC-poor isochore families L1, L2, and H1), where gene density is low (see Figure 6). The genome desert and the genome core represent about 88% and 12%, respectively, of the genome, whereas the gene number is approximately the same in the two “gene spaces”.
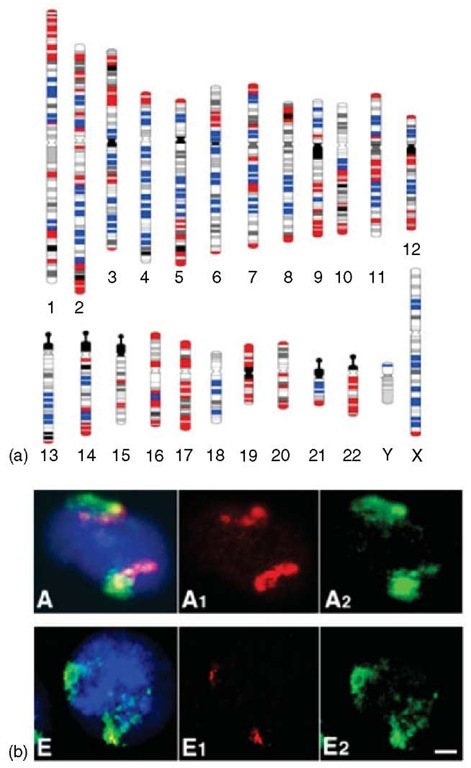
The two gene spaces are associated, as just mentioned, with different structural, functional, and evolutionary properties (see Figure 6). Among the former ones, the size of introns and untranslated regions (UTR) are large in the genome desert, but small in the genome core. The distribution of the DNA from the two gene spaces is quite different in metaphase chromosomes, the gene-dense regions of H2 and H3 isochores being predominant in or near telomeres, the gene-poor regions mainly near the centromeres (Figure 7a). Most interestingly, in the interphase nucleus, the gene-dense regions of chromosome are very “open” and centrally located, whereas the gene-poor regions are densely packed against the nuclear membrane (Figure 7b).
Correlations with structure and function
| Intro, UTR size | Large | Small |
| Chromatin structure | Closed | Open |
| GC Heterogeneity | Low | High |
| Gene experssion | Low | High |
| Replication timing | Late | Early |
| Recombination | Low | High |
Figure 6 Gene distribution in the human genome. The major structural, functional, and evolutionary properties associated with each gene space are listed
Figure 7 (a) Identification of the GC-poorest and the GC-richest chromosomal bands. Human karyotype at a resolution of 850 bands showing the chromosomal bands containing the GC-poorest (L1+, blue bars) and the GC-richest isochores (H3 +, red bars). The former correspond to G (iemsa) bands, the latter to R (everse) bands. The “intermediate” bands (the 50% of 80 bands that are neither GC- and gene-poorest nor GC- and gene-richest) are shown in white for the H3- R bands, in gray (according to Francke, 1994) for the L1- G bands (Modified from Federico et al., 2000). (b) Nuclear distribution of chromosomal regions characterized by different GC levels. 15-20 Mb chromosomal regions corresponding to GC-richest bands 6p21 (A) and 12q21 GC-poorest (E) were cohybridized with the corresponding chromosome probes. Band and chromosome DNAs were biotin- (red signals) and digoxigenin- (green signals) labeled, respectively. Nuclei were DAPI stained (blue).
This latter finding not only accounts for the fact that gene-dense regions have a high transcription level compared to gene-poor regions but also for the need of the open chromatin of the former to be stabilized thermodynamically by a GC increase at the emergence of warm-blooded vertebrates. In contrast, the gene-poor regions are stabilized by their closed chromatin structure. Other distinctive functional properties concern replication timing (late and early in the genome desert and in the genome core, respectively) and recombination, which is frequent in the first case and rare in the second.
In summary, the bimodal gene distribution revealed by the compositional approach used in our work and confirmed by all subsequent sequencing investigations (see Article 28, The distribution of genes in human genome, Volume 3) is strongly correlated with essential structural, functional, and evolutionary properties of the genome.
