5.3.4
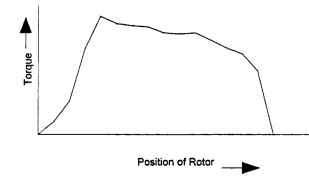
Run in the open-loop mode, these motors have performance characteristics similar to those of VR stepper motors. Static torque curves can be plotted by turning on the phase current of one phase Ph1, rotating the shaft through one stroke angle, and measuring the stator reaction torque (Fig. 5.101).
As subsequent phases are plotted relative to each other, the complete torque profile, as shown in Fig. 5.102, is produced. The intersection of the torque curves is the maximum continuous torque that can be expected.

FIGURE 5.101 Torque versus rotor position: one phase on.
In the running mode, with a constant voltage supply of increasing frequency, the motor accelerates with decreasing torque (Fig. 5.103). The speed-torque curve resembles that of a universal motor. In this case, the torque decreases because the inductance limits the winding current as the switching frequency increases. Core losses are also increased as frequency increases. Employing a control system that overcomes the inductance and increases coil current at high speeds will significantly improve the output torque.


FIGURE 5.102 Torque versus rotor position: four phases on.

FIGURE 5.103 Speed-torque curve switched-reluctance motor.

FIGURE 5.104 Kf curve for switched-reluctance motor.


FIGURE 5.105 6/4 3-phase switched-reluctance motor.

Performance Characteristics (Electric Motors)
Next post: Design Procedures (Electric Motors)
Previous post: Selection of Poles and Phases (Electric Motors)
