Reflectometry
In this section we describe the central reflectometry algorithm used in this work. The basic goal is to determine surface reflectance properties for the scene such that renderings of the scene under captured illumination match photographs of the scene taken under that illumination. We adopt an inverse rendering framework as in [21,29] in which we iteratively update our reflectance parameters until our renderings best match the appearance of the photographs. We begin by describing the basic algorithm and continue by describing how we have adapted it for use with a large dataset.
General Algorithm
The basic algorithm we use proceeds as follows:
1. Assume initial reflectance properties for all surfaces
2. For each photograph:
(a) Render the surfaces of the scene using the photograph’s viewpoint and lighting
(b) Determine a reflectance update map by comparing radiance values in the photograph to radiance values in the rendering
(c) Compute weights for the reflectance update map
3. Update the reflectance estimates using the weightings from all photographs
4. Return to step 2 until convergence
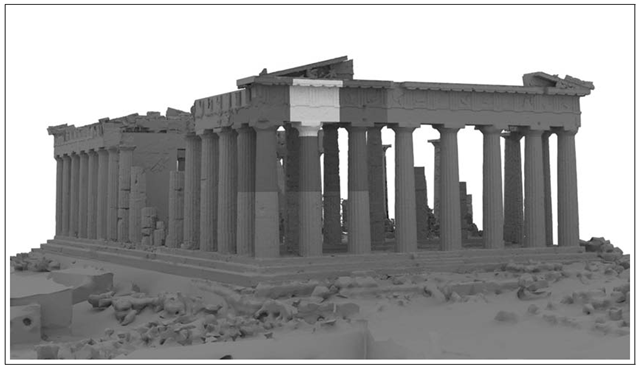
FIGURE 6.13
Complete model assembled from the 3D scanning data, including low-resolution geometry for the surrounding terrain. High- and medium-resolution voxels used for the multiresolution reflectance recovery are indicated in white and blue.
For a pixel’s Lambertian component, the most natural update for a pixel’s Lambertian color is to multiply it by the ratio of its color in the photograph to its color in the corresponding rendering. This way, the surface will be adjusted to reflect the correct proportion of the light. However, the indirect illumination on the surface may change in the next iteration since other surfaces in the scene may also have new reflectance properties, requiring further iterations.
Since each photograph will suggest somewhat different reflectance updates, we weight the influence a photograph has on a surface’s reflectance by a confidence measure. For one weight, we use the cosine of the angle at which the photograph views the surface. Thus, photographs which view surfaces more directly will have a greater influence on the estimated reflectance properties. As in traditional image-based rendering (e.g., [43]), we also downweight a photograph’s influence near occlusion boundaries. Finally, we also downweight an image’s influence near large irradiance gradients in the photographs since these typically indicate shadow boundaries, where small misalignments in lighting could significantly affect the reflectometry.
In this work, we use the inferred Lafortune BRDF models described in Sec. 6.3.2 to create the renderings, which we have found to also converge accurately using updates computed in this manner. This convergence occurs for our data since the BRDF colors of the Lambertian and retroreflective lobes both follow the Lambertian color, and since for all surfaces most of the photographs do not observe a specular reflection. If the surfaces were significantly more specular, performing the updates according to the Lambertian component alone would not necessarily converge to accurate reflectance estimates. We discuss potential techniques to address this problem in the future work section.
Multiresolution Reflectance Solving
The high-resolution model for our scene is too large to fit in memory, so we use a multiresolution approach to computing the reflectance properties. Since our scene is partitioned into voxels, we can compute reflectance property updates one voxel at a time. However, we must still model the effect of shadowing and indirect illumination for the rest of the scene. Fortunately, lower-resolution geometry can work well for this purpose. In our work, we use full-resolution geometry (approx. 800K triangles) for the voxel being computed, medium-resolution geometry (approx. 160K triangles) for the immediately neighboring voxels, and low-resolution geometry (approx. 40K triangles) for the remaining voxels in the scene. The surrounding terrain is kept at a low resolution of 370K triangles. The multiresolution approach results in over a 90% data reduction in scene complexity during the reflectometry of any given voxel.
Our global illumination rendering system was originally designed to produce 2D images of a scene for a given camera viewpoint using path tracing [44]. We modified the system to include a new function for computing surface radiance for any point in the scene radiating toward any viewing position. This allows the process of computing reflectance properties for a voxel to be done by iterating over the texture map space for that voxel. For efficiency, for each pixel in the voxel’s texture space, we cache the position and surface normal of the model corresponding to that texture coordinate, storing these results in two additional floating-point texture maps.
1. Assume initial reflectance properties for all surfaces.
2. For each voxel V:
• Load V at high resolution, V’s neighbors at medium resolution, and the rest of the model at low resolution.
• For each pixel p in V’s texture space:
- For each photograph I :
* Determine if p’s surface is visible to I’s camera. If not, break. If so, determine the weight for this image based on the visibility angle, and note pixel q in I corresponding to p’s projection into I.
* Compute the radiance l of p’s surface in the direction of I’s camera under I’s illumination.
* Determine an updated surface reflectance by comparing the radiance in the image at q to the rendered radiance l.
- Assign the new surface reflectance for p as the weighted average of the updated reflectances from each I.
Return to step 2 until convergence
Figure 6.14 shows this process of computing reflectance properties for a voxel. Figure 6.14(a) shows the 3D model with the assumed initial reflectance properties illuminated by a captured illumination environment. Figure 6.14(b) shows the voxel texture-mapped with radiance values from a photograph taken under the captured illumination in (a). Comparing the two, the algorithm determines updated surface reflectance estimates for the voxel, shown in Figure 6.14(c). The second iteration compares an illuminated rendering of the model with the first iteration’s inferred BRDF properties to the photograph, producing new updated reflectance properties shown in Fig. 6.14(d). For this voxel, the second iteration produces a darker Lambertian color for the underside of the ledge, which results from the fact that the black BRDF sample measured in Section 6.3.2 has a higher proportion of retroreflection than the average reflectance. The second iteration is computed with a greater number of samples per ray, producing images with fewer noise artifacts. Reflectance estimates for three voxels of a column on the East facade are shown in texture atlas form in Figure 6.15. Reflectance properties for all voxels of the two facades are shown in Figures 6.16(b) and 6.19(d). For our model, the third iteration produces negligible change from the second, indicating convergence.
FIGURE 6.14
Computing reflectance properties for a voxel (a) Iteration 0: 3D model illuminated by captured illumination, with assumed reflectance properties; (b) Photograph taken under the captured illumination projected onto the geometry; (c) Iteration 1: New reflectance properties computed by comparing (a) to (b). (d) Iteration 2: New reflectance properties computed by comparing a rendering of (c) to (b).
FIGURE 6.15
Estimated surface reflectance properties for an East facade column in texture atlas form.
FIGURE 6.16
(a) One of eight input photographs; (b) Estimated reflectance properties; (c) Synthetic rendering with novel lighting.
Results
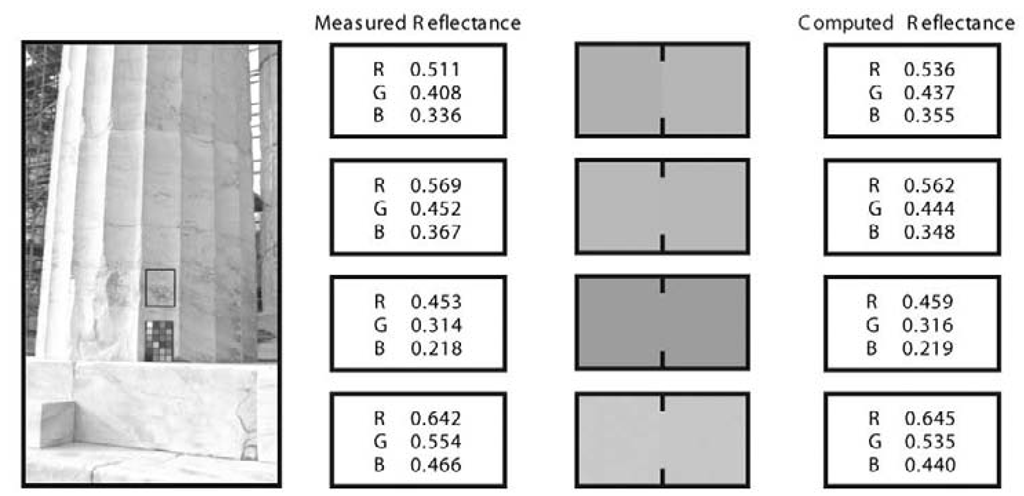
FIGURE 6.17
Left: Acquiring a ground truth reflectance measurement. Right: Reflectance comparisons for four locations on the East facade.
We ran our reflectometry algorithm on the 3D scan dataset, computing high-resolution reflectance properties for the two westmost and eastmost rows of voxels. As input to the algorithm, we used eight photographs of the East facade (e.g., Figure 6.16(a)) and three of the West facade, in an assortment of sunny, partly cloudy, and cloudy lighting conditions. Poorly scanned scaffolding which had been removed from the geometry was replaced with approximate polygonal models in order to better simulate the illumination transport within the structure. The reflectance properties of the ground were assigned based on a sparse sampling of ground truth measurements made with a MacBeth chart. We recovered the reflectance properties in two iterations of the reflectometry algorithm. For each iteration of the reflectometry, the illumination was simulated with two indirect bounces using the inferred Lafortune BRDFs. Computing the reflectance for each voxel required an average of ten minutes.
Figures 6.16(b) and 6.19(d) show the computed Lambertian reflectance colors for the East and West facades, respectively. Recovered texture atlas images for three voxels of the East column second from left are shown in Figure 6.15. The images show few shading effects, suggesting that the maps have removed the effect of the illumination in the photographs. The subtle shading observable toward the back sides of the columns is likely the result of incorrectly computed indirect illumination due to the remaining discrepancies in the scaffolding.
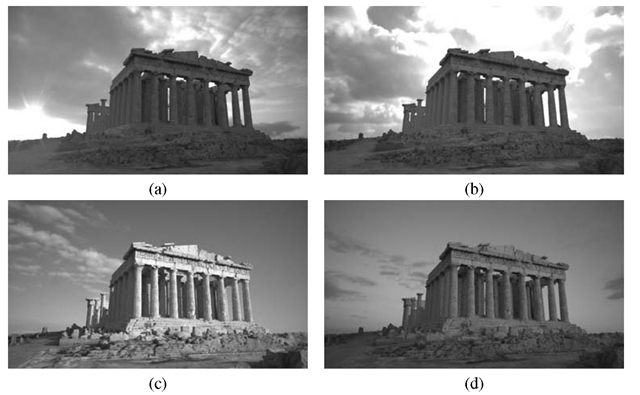
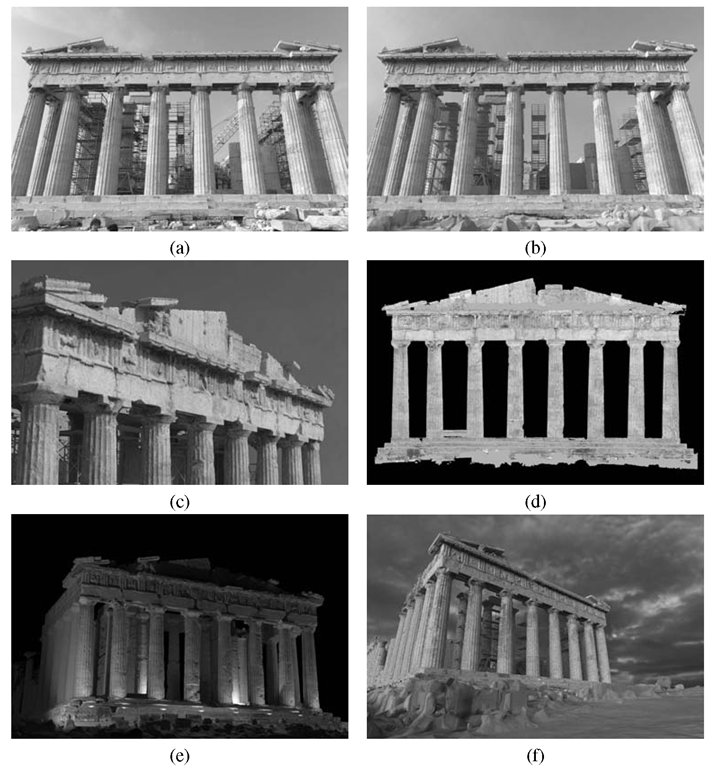
Figures 6.19(a) and (b) show a comparison between a real photograph and a synthetic global illumination rendering of the East facade under the lighting captured for the photograph, indicating a consistent appearance. The photograph represents a significant variation in the lighting from all images used in the reflectometry dataset. Figure 6.19(c) shows a rendering of the West facade model under novel illumination and viewpoint. Figure 6.19(e) shows the East facade rendered under novel artificial illumination. Figure 6.19(f) shows the East facade rendered under sunset illumination captured from a different location than the original site. Figure 6.18 shows the West facade rendered using high-resolution lighting environments captured at various times during a single day.
To provide a quantitative validation of the reflectance measurements, we directly measured the reflectance properties of several surfaces around the site using a MacBeth color checker chart. Since the measurements were made at normal incidence and in diffuse illumination, we compared the results to the Lambertian lobe directly, as the specular and retroreflective lobes are not pronounced under these conditions. The results tabulated in Figure 6.17 show that the computed reflectance largely agreed with the measured reflectance samples, with a mean error of (2.0%, 3.2%, 4.2%) for the red, green, and blue channels.
FIGURE 6.18
Rendering of a virtual model of the Parthenon with lighting from 7:04am (a), 10:35am (b), 4:11pm (c), and 5:37pm (d). Capturing high-resolution outdoor lighting environments with over 17 stops of dynamic range with time lapse photography allows for realistic lighting.
Discussion and Future Work
Our experiences with the process suggest several avenues for future work. Most importantly, it would be of interest to increase the generality of the reflectance properties which can be estimated using the technique. Our scene did not feature surfaces with sharp specularity, but most scenes featuring contemporary architecture do. To handle this larger gamut of reflectance properties, one could imagine adapting the BRDF clustering and basis formation techniques in [5] to photographs taken under natural illumination conditions. Our technique for interpolating and extrapolating our BRDF samples is relatively simplistic; using more samples and a more sophisticated analysis and interpolation as in [32] would be desirable. A challenge in adapting these techniques to natural illumination is that observations of specular behavior are less reliable in natural illumination conditions. Estimating reflectance properties with increased spectral resolution would also be desirable.
In our process the photographs of the site are used only for estimating reflectance, and are not used to help determine the geometry of the scene. Since high-speed laser scan measurements can be noisy, it would be of interest to see if photometric stereo techniques as in [2] could be used in conjunction with natural illumination to refine the surface normals of the geometry. Yu et al. [6] for example used photometric stereo from different solar positions to estimate surface normals for a building’s environment; it seems possible that such estimates could also be made given three images of general incident illumination with or without the sun.
FIGURE 6.19
(a) A real photograph of the East facade, with recorded illumination; (b) Rendering of the model under the illumination recorded for (a) using inferred Lafortune reflectance properties; (c) A rendering of the West facade from a novel viewpoint under novel illumination. (d) Front view of computed surface reflectance for the West facade (the East is shown in 6.16(b)). A strip of unscanned geometry above the pediment ledge has been filled in and set to the average surface reflectance. (e) Synthetic rendering of the West facade under a novel artificial lighting design. (f) Synthetic rendering of the East facade under natural illumination recorded for another location. In these images, only the front two rows of outer columns are rendered using the recovered reflectance properties; all other surfaces are rendered using the average surface reflectance.
Our experience calibrating the illumination measurement device showed that its images could be affected by sky polarization. We tested the alternative of using an upward-pointing fisheye lens to image the sky, but found significant polarization sensitivity toward the horizon as well as undesirable lens flare from the sun. More successfully, we used a 91% reflective aluminum-coated hemispherical lens and found it to have less than 5% polarization sensitivity, making it suitable for lighting capture. For future work, it might be of interest to investigate whether sky polarization, explicitly captured, could be leveraged in determining a scene’s specular parameters [45].
Finally, it could be of interest to use this framework to investigate the more difficult problem of estimating a scene’s reflectance properties under unknown natural illumination conditions. In this case, estimation of the illumination could become part of the optimization process, possibly by fitting to a principal component model of measured incident illumination conditions.
Conclusion
We have presented a process for estimating spatially-varying surface reflectance properties of an outdoor scene based on scanned 3D geometry, BRDF measurements of representative surface samples, and a set of photographs of the scene under measured natural illumination conditions. Applying the process to a real-world archaeological site, we found it able to recover reflectance properties close to ground truth measurements, and able to produce renderings of the scene under novel illumination consistent with real photographs. The encouraging results suggest further work be carried out to capture more general reflectance properties of real-world scenes using natural illumination.


