Monitoring your server
The central panel of VisualVM is the pulsing heart of the application. There you have access to all available profiler plugins. As a matter of fact, VisualVM is fully extensible and you can install additional plugins, which will monitor specific areas of your JVM. In the section, Extending VisualVM, we will show how to add some additional plugins to your VisualVM.
As shown in the following picture, you initially have the following tabs available:
• Overview: This tab shows generic server info like JVM arguments and system properties.
• Monitor: This tab reveals a real-time set of graphs which collect data for the CPU, memory utilization, class loaded, and threads used.
• Threads: This tab provides a detailed view of all threads running in the JVM along with their state (Running, Sleeping, Wait, and Monitor).
• Profiler: This tab enables you to start and stop the profiling session of a local application. You can choose from the following profiling options:
° CPU Profiling: Choose this to profile the performance of the application.
° Memory Profiling: Choose this to analyze the memory usage of the application.
The Monitor tab
The Monitor tab plugin is useful to monitor the JVM in real-time. In the following image you can see how it looks like when you connect to a freshly booted JBoss AS 5.1.0 server:
As we have anticipated, you can perform both a Garbage Collection and launch a Heap dump from this panel. Performing a garbage collection can be done by means of the Perform GC button; on the other hand, clicking on the Heap Dump button allows you to create a snapshot of your JVM Heap which can be saved and examined later.
By means of the Heap Dump, you can check the number of object instances created at any time and even inspect the content of the single instance fields thus making VisualVM a valuable option also for inspecting the status of applications deployed.
The Threads tab
The Threads tab displays a timeline of current thread activity. You can click a thread in the Timeline to view details about that thread in the Details tab:
A Timeline for each thread provides a quick overview of the thread’s activity. The drop-down list enables you to select which threads are displayed. You can choose to view all threads, live threads, or finished threads. You can also select a single thread or multiple threads to display a subset of the threads.
The Details tab displays more detailed information about individual threads. For each thread, the name, classname, and current status (alive/finished) are displayed. A short description of the thread is also provided.
As a side note you can also take a Thread Dump (stack trace) while a local application is running. Taking a Thread Dump does not stop the application. When you print the Thread Dump you get a printout of the thread stack that includes thread states for the Java threads. This can look a bit cumbersome compared to VisualVM simple statistics but it can be still useful if you have any console script which analyzes the output of the Java stack trace.
The Profiler tab
The Profiler option requires quite a lot of resources from your machine so it is not enabled by default. When you start a profiling session, VisualVM attaches to the local application and starts collecting profiling data. When profiling results are available they are automatically displayed in the Profiler tab.
You can choose from the following profiling options:
• CPU Profiling: Choose this to profile the performance of the application.
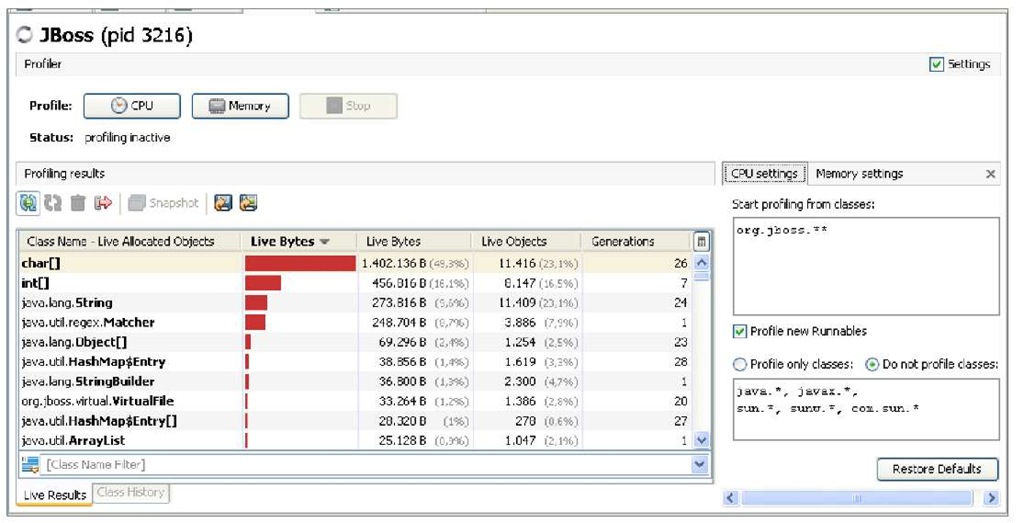
• Memory Profiling: Choose this to analyze the memory usage of the application. The results display the objects allocated by the application and the class allocating those objects.
The following image depicts a Memory Profiling session: start by clicking on the Memory button which will begin the Profiler Session. This activity is quite costly for your CPU so it’s likely that your PC will freeze for a while until the initialization is complete.
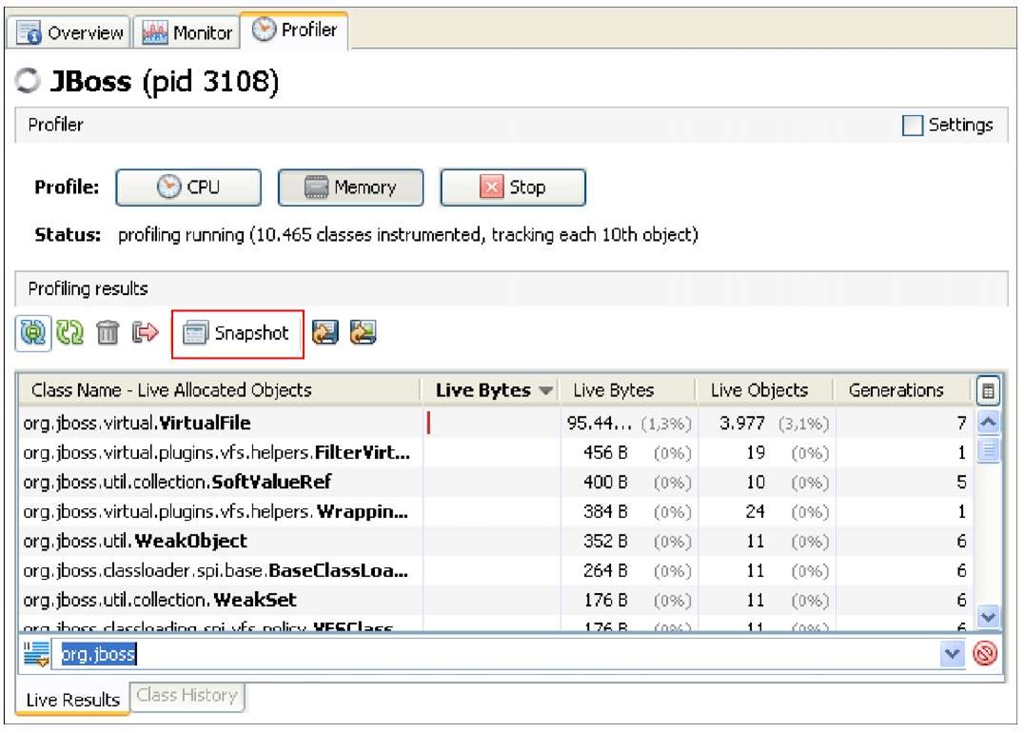
When data profiling is started, you will see the first results in the Profiling results table which shows the impact on memory (or on CPU if you are profiling the CPU) of each class allocation:
If you are not interested in knowing the details of all the objects created, then you can filter by package (or Classes too) in the lower section of the table.
Collecting snapshots
A Snapshot is a handy feature of VisualVM which allows you to capture application data and save it to your local system for later use. The advantage of using Snapshots is that the target application does not need to be running so that they can be viewed by any user.
VisualVM distinguishes between two types of snapshot:
• Profiler Snapshot
• Application Snapshot
Profiler snapshots, as the name implies, are generated when you are running a Profiler session. A Profiler snapshot either contains data for allocated objects (if you are running a Memory profiler session) or application performance data (if you are running a CPU profiler session).
To take a snapshot, simply click the Snapshot button in the Profiler tab.
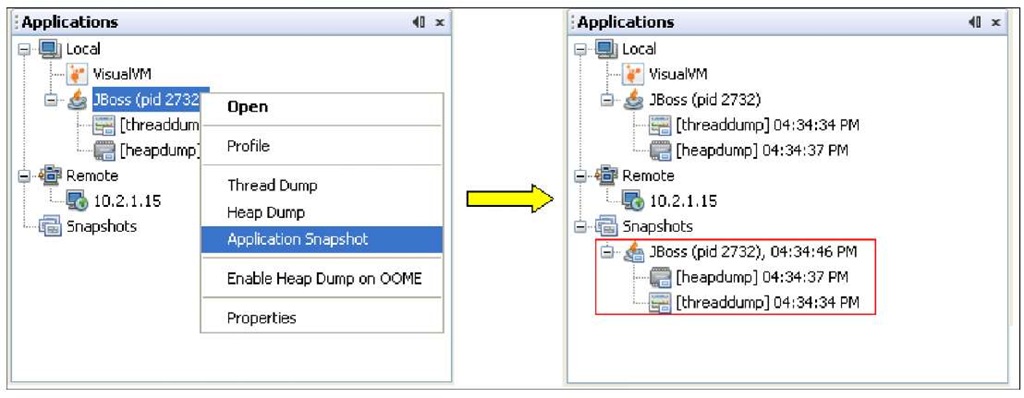
Once taken, the collected snapshot will be included within the application server tree, as shown by the following image:
An application snapshot is a bit more complex as it contains all the collected Heap Dumps, Thread Dumps and profiler snapshots of an application at the moment the snapshot is taken. An application snapshot also captures general information about the Java Virtual Machine (JVM).
You take an application snapshot by right-clicking an application node in the Applications window and choosing Application Snapshot from the pop up menu. In the following image, we are gathering a Thread Dump and a Heap Dump in an application snapshot:
Using Snapshots to detect potential memory leaks
One nifty feature not known by all developers is the ability to compare snapshots. Provided that you have collected two snapshots in a different timeline (for example, before and after one core procedure), then you can compare them by selecting Compare Snapshot on the right-click selection.
This will add one more tab to your main window titled Snapshot comparison which contains the difference in allocated memory objects or time execution. On the basis of this comparison you can pinpoint which objects are potential memory leaks or bottlenecks of the application.
Extending VisualVM
With VisualVM you are not restricted to the basic functionalities we have covered here but you can expand them by downloading extra plugins.
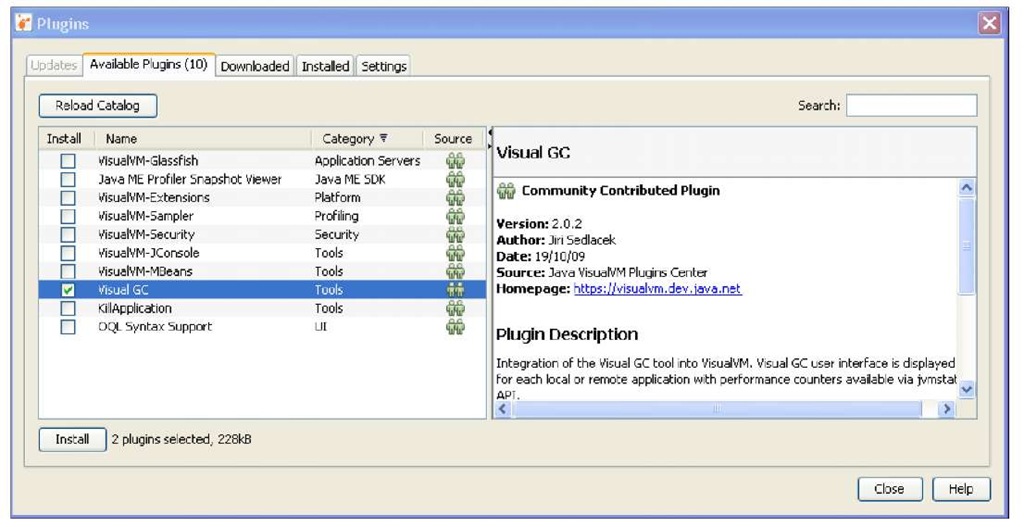
In order to install new plugins, from the main menu choose Tools | Plugins; the Plugins dialog is opened. Switch to the Available Plugins tab and select the plugin you want to install.
There are quite a bit of available plugins: for the purpose of this topic, you will need to install the Visual GC plugin, which can be used to collect and graphically display the garbage collector dynamics.
Installing a new plugin can be done by means of the Tools | Plugins menu option. The following image resumes the suggested selection. Click on Install and restart VisualVM to allow the changes to take effect.
![tmp39-17_thumb[2] tmp39-17_thumb[2]](http://what-when-how.com/wp-content/uploads/2011/09/tmp3917_thumb2_thumb.jpg)


![tmp39-22_thumb[2] tmp39-22_thumb[2]](http://what-when-how.com/wp-content/uploads/2011/09/tmp3922_thumb2_thumb.jpg)


