I’ve personally designed, built, and tested all of the motors in this topic. If you’ve copied one of these designs, used the same propellant. and adjusted your motor’s maximum thrust to match the published value, then the other performance parameters will be at least “within the ball park” of the stated values. If you’ve adjusted the carbon fuel ratios so that the baking soda content is the same, the match will be even closer, and the thrust-time curve should be a pretty good match too. If you want to gather your own data, and generate your own thrust-time curves, you can do it with a homemade chart recorder (Figure 18-17).
The chart drum in the photos is made from a sheet metal. 3 pound Dak Imported Danish Butter Cookie box. You’ll find these cookies (or similar cookies) in all the markets around Christmas Time, and at other times of the year you’ll see the empty boxes at swap meets and yard sales. I bought the one in the photo at The Price Club. The Dak box is 10-1/4″ dia. by 4-1/4″ tall. Other cookie and fruit cake boxes will work as well, but try to avoid anything smaller than 8″ dia.
The cookie box revolves on a 6″ dia. “Lazy Susan” bearing. The bearing that I used for this prototype is made by Faultless, but any brand will do. You’ll find them at the big hardware warehouses like Home Depot and Lowe’s. The cookie box and bearing are driven by a Hurst model PA, part #3202-014. 6 rpm synchronous motor. The motor is the major expense: about S60 at the time of this writing. But with a little ingenuity you can substitute another motor, as long as it maintains a constant speed of at least 4 rpm. and not more than 10 rpm.
Low speed synchronous and gear head motors are common surplus items, and most cities have dealers who specialize in electronic and industrial surplus. For example, at the time of this writing, there is a well known place in Pasadena. Calif., called C&H Sales. They sell things like power supplies, meters, transformers, test equipment, small electronic parts, used optics, and assorted other industrial “stuff”. Their stock is constantly changing, but in one of their recent catalogues, they offered a 5 RPM. 120 volt, gear head motor for S7.95. The exact motor dimensions, the mounting hole pattern, and the shaft size are different than the ones on the Hurst motor, but with a minor modification of the chart recorder design, this motor would work just fine. To find a surplus dealer, look in The Yellow Pages under the SURPLUS headings, or search the Internet.
If you can’t find a surplus motor, and you must buy something new. try to find the same motor described in these instructions. Hurst synchronous motors are made by Hurst Manufacturing, 1551 E. Broadway, Princeton, IN 47670. They are
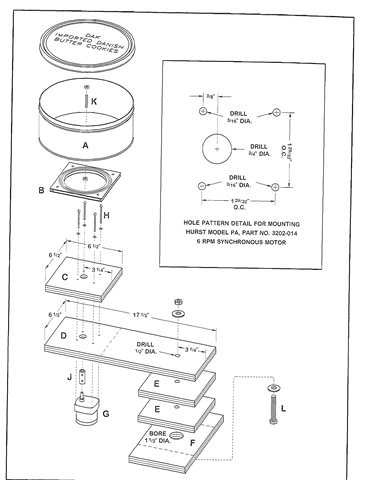
Figure 18-18. An exploded view of the chart recorder assembly. The capital letters in this drawing refer to the capital letters in the materials list on page 481.
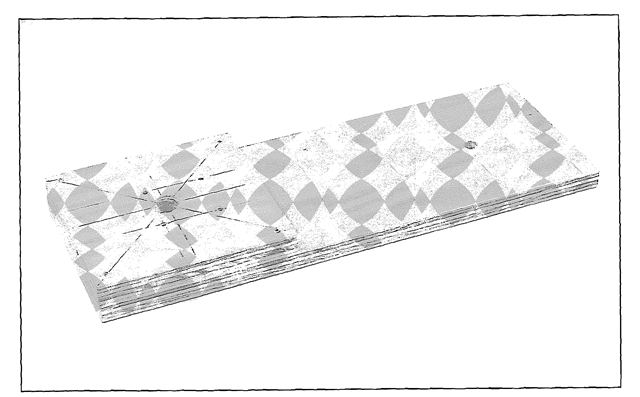
Figure 18-19. The plywood pieces for the bearing support and the pivot arm are glued together. The holes for mounting the chart drive motor and the pivot bolt are drilled.
specially designed to maintain the highly accurate speeds needed for things like clocks and industrial equipment timers. Because of the specialized applications in which they are used, they are not sold by electric motor shops, and you’ll have to go to a Hurst distributor to buy one.
I’d originally hoped to include a list of Hurst distributors in this topic, but as the work on this topic proceeded. I noticed that, with the exception of WAV. Grainger, Hurst’s list of distributors kept changing. It would therefore be best for you to contact Hurst directly. Tell them where you live, and tell them that you need a PA-3202-014 6 rpm synchronous motor. Then ask them for the name and contact information of the nearest dealer who can sell you one. At the time of this writing. Hurst has a website on the Internet at www.myhurst.com/hurstmfg.
WAV. Grainger Inc. has so many retail outlets that you won’t need an address. Just look in the white pages of your phone topic, or go to their website at www.grainger.com. At the time of this writing, the Hurst PA-3202-014 synchronous motor is listed in the Grainger catalogue.
The chart drum assembly pivots on a wide plywood arm. so that it can be rotated into or away from the test stand’s recording pen. The chart paper is a strip of 3″ to 3-l/4″-wide. paper calculator tape. If you use a shorter cookie box. you’ll need a narrower tape, but there are many widths available, and finding one that works shouldn’t be a problem. Look for the tape at stationery stores and places like Office Depot.
Important note. The drive shaft coupler was not easy to find. After “striking out” at several hardware stores. I ended up again at W.W. Grainger. Grainger sells them in sizes to fit 1/4″ dia. through 1″ dia. shafts. The one that fits the Hurst motor is Grainger’s stock #6L012. It is listed in the Grainger catalogue under “Rigid Steel Couplings”. You can also buy these couplers from the dealers that sell gears and bearings. Look in The Yellow Pages under BEARINGS. What follows immediately are the instructions for putting together the chart recorder shown in the photos. Figure 18-18 on page 479 is an exploded view of the recorder’s components, and the letters in the illustration refer to the capital letters in the materials list on page 481. To build a homemade chart recorder, refer to Figure 18-18. and proceed as follows.
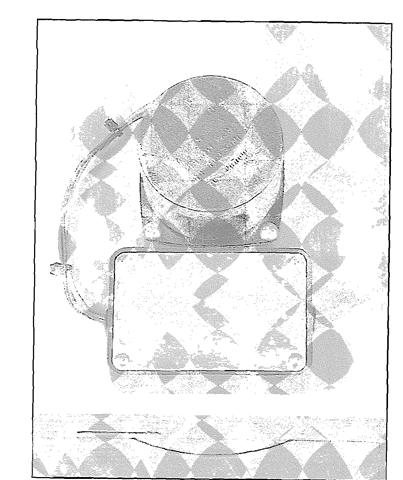
Figure 18-20. A plastic box purchased at Radio Shack protects the motor’s electrical connections.
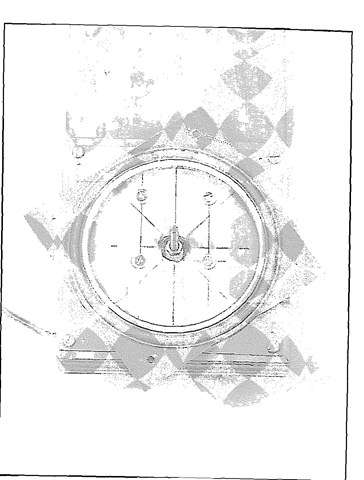
Figure 18-21. The ” Susan” chart drum bearing is centered around the drive shaft, and mounted on the bearing support with 4 sheet metal screws.
MATERIALS LIST
A. Chart drum: One 10-1/4″ dia. X 4-1/4″ high Dak Imported Danish Butter Cookie box (or similar)
B. Chart drum bearing: One Faultless brand, 6″ dia. “Lazy Susan” turntable bearing (or similar)
C. Chart drum bearing support: One piece 3/4″ CDX or better grade plywood. 6-1/2″ square.
D. Chart drive pivot arm: One piece 3/4″ CDX or better grade plywood. 6-1/2″ wide x 17-1/2″ long.
E. Pivot arm support: Two pieces 3/4″ CDX or better grade plywood, 6-1/2″ square.
F. Pivot arm base: One piece 3/4″ CDX or better grade plywood, 6-1/2″ x 12″.
G. Chart drive motor: One Hurst model PA, part number 3202-014. 6 rpm synchronous motor
H. Four #8-32 x 2″ R.H. bolts with washers.
J. Drive shaft coupler: One 1/4″ steel shaft coupler with two set screws. Grainger’s #6L012 (or similar).
K. Chart drum drive shaft: One piece 1/4″x20 threaded steel rod 2″ long with two nuts.
L. Pivot arm bolt: One 1/2″ x 3″ hex head bolt with one nut and two washers NOT SHOWN in FIGURE 18-18. Four #10 x 1/2″ F.H. sheet metal screws.
1. Cut the plywood pieces for the bearing support (Figure 18-18-C i and the pivot arm (Figure 18-18-D). and glue and clamp them together. Drill the hole pattern for mounting the chart drive motor, and drill the 1/2″ dia. pivot bolt hole at the opposite end of the pivot arm (Figure 18-19). The screw holes for mounting the bearing are also visible in Figure 18-19.
2. Connect the chart drum drive shaft (Figure 18-18-K ) and the drive shaft coupler i Figure 18-18-J ) to the Hurst synchronous motor (Figure 18-18-G). Run the lower drive shaft nut down onto the shaft, and mount the motor to the underside of the pivot arm with the four #8-32 x 2″ R.H. machine bolts and u as hers (Figure 18-18-H i. Wire the motor as shown in Hurst’s wiring diagram for 110 v. A.C. and counterclockwise rotation. Figure 18-20 shows how I did it. I bought a small, plastic box at Radio Shack to protect the electrical connections and the motor’s capacitor.
3. Mount the chart drum bearing {Figure 18-18-B) to the bearing support (Figure 1S-18-C ) with four #10 x 1/2″ F.H. sheet metal screws (Figure 18-21). and center the bearing around the drive shaft as accurately as you can.
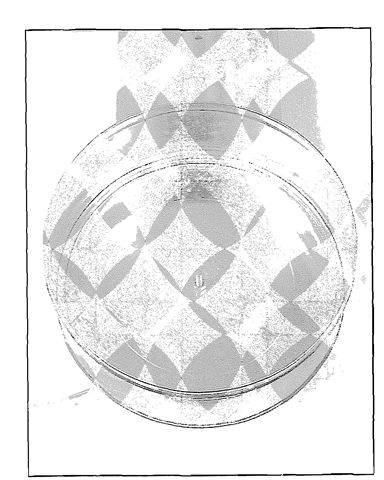
Figure 18-22. The upper drive shaft nut holds the chart drum firmly on the drive shaft. The positions of both nuts are adjusted to hold the drum gently down on the bearing.
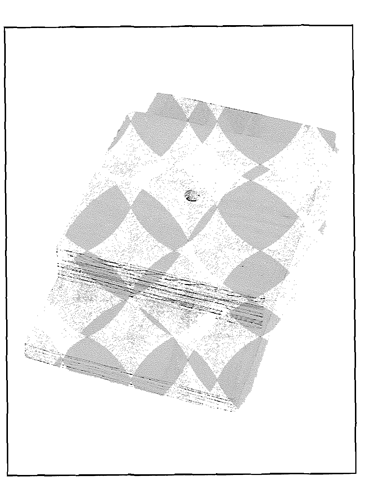
Figure 18-23. The two pivot arm supports are glued and clamped to the pivot arm base, and the hole is drilled for the pivot arm bolt.
4. Drill a 1 /4″ dia. hole in the exact center of the bottom of the cookie box (Figure 18-18-A). and locate it accurately. If the hole is off-center, the cookie box-chart drum will wobble as it turns. Set the cookie box down on the bearing, so that the drive shaft extends up through the hole you just drilled, But first run the lower drive shaft nut up. so that it just touches the bottom of the box when the box is in place. Then screw on and tighten the upper drive shaft nut (Figure 18-22 ). You’ll have to experiment with the exact positions of the two nuts until the cookie box rests firmly on the bearing, but not so tight that it jerks or binds when the motor turns.
5. Drill a 1/2″ dia. hole through the center of the two pivot arm supports (Figure 18-18-E ). and cut a 1-1/2″ dia. hole in the center of the pivot arm base (Figure 18-18-F). This hole provides a recess for the head of the pivot arm bolt and one of its washers. Glue and clamp the two pivot arm supports to the pivot arm base (Figure 18-23). Then connect the plywood assembly you just made to the pivot arm with the pivot arm bolt (Figure 18-18-L). the pivot arm nut. and the two washers.
As you can see. I don’t recommend that you install a switch in the chart drive circuit, and this is because, for safety reasons, you should be standing at least 25 feet away when you turn on the drive and fire a motor. I recommend, instead, that you plug the drive into a long extension cord, and plug that extension cord into one of the switched power strips designed for use with home computers.
Finally, because the test stand and the chart recorder are made of wood, spray the plywood parts with a few coats of lacquer or varnish before assembly, and store the test stand and the recorder in a warm, dry place when not in use.
A Thrust-Time Curve
To demonstrate the chart recorder. I’ll again use an experimental NV6-powered motor with a 3/4″ i.d. casing, a 1/4″ dia. nozzle throat, mid a propellant mass (m ) of 61.0 grams. To set up for the test, clamp the chart recorder in place on the test stand’s base, and tape a strip of calculator tape tightly around the drum (Figure 18-24 ). Position the recorder so that the paper makes square contact with the pen when the chart drum is rotated into position. You’ll find that spring clamps work nicely for holding the recorder in place, and for my DAK-cookie-box recording drum, the extra-wide 3″ to 3-1/4″ calculator tape works best.
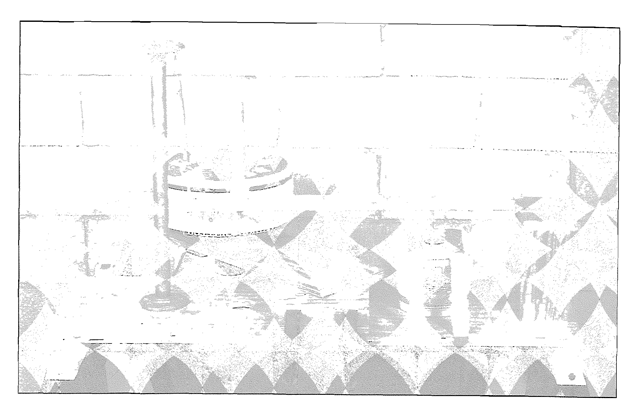
Figure 18-24. The homemade lest stand with an experimental motor and the homemade chart recorder. The chart paper has been taped in place, and the chart drum has been related into position against the pen.
1. Set up the test .stand w ith an appropriate spring. Wrap masking tape around the front of the motor, and fit it snugly into the stand’s motor holder. Then calibrate the stand with a know n weight. As before, the weight should be close to the expected motor thrust, and for this test. 10 lbs. will again work nicely.
With the motor in place, rotate the chart drum into position so that the pen touches the paper. Turn on the chart drive, and allow the pen to scribe a line around the full circumference of the drum (Figure 18-25 i. I call this the zero line, and it represents a thrust of 0 lbs. Turn off the chart drive, and move the drum away from the pen. Find the bucket that \ ou used for the pre\ ioits thrust stand calibration ( pages 475 – 477 /. and fill it with sand again until the total weight of the bucket plus the sand plus the hooks plus the chain equals 10.0 lbs. Hang the bucket from the evebolt under the motor holder. Slide the chart drum into contact w ith the pen. Turn on the chart drive, and allow the pen to scribe a second line around the circumference of the drum (Figure 18-25 ). I call this the calibration line, and it represents a thrust of 10.0 lbs.
2. Turn off the chart drh e. Rotate the drum aw a\ from the pen. and remove the calibration w eight t the sand-filled bucket, the hooks, and the chain i. Insert a properh w ired electric igniter into the rocket motor’s nozzle. Rotate the chart drum back into place against the pen. Move back to a safe distance. Turn on the chart drive, fire the rocket motor, and wait for the thrust arm to come to rest. As the chart drum turns, the motion of the pen against the also-moving paper will generate an accurate thrust-time cur\e t Figure 18-26 ). Turn off the chart drive. Rotate the chart drum away from the pen. and cap the pen. Then remove the paper strip from the chart drum, and take it to your desk for analysis.
Chart Speed
With the chart of a successful test in hand. vou can obtain an amazing amount of information. but//m you have to know how fast the chart is nun ing in inches-per-second. The Hurst model PA-3202-014 motor turns at 6 rpm. which works out to 1 revolution e\ery 10 seconds. The diameter of the DAK cookie box is 10.25″. To find the box’s circumference, multiply its diameter bv TT (3.14i. In this case, the answer is 32.185 inches, which vou can round off to 32.2. To find the speed of the chart, divide the circumference of the box (32.2″) by the time it takes to make one revolution (10 seconds). 32.2/ 10 = 3.22. so with this cookie box. the chart moves at a linear speed of 3.22 inches per second.
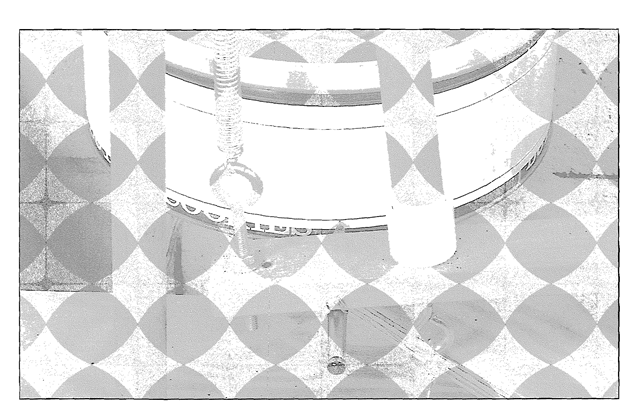
Figure 18-25. A zero line and a calibration line are scribed around the full circumference of the drum.
![tmp9D-2_thumb[1] tmp9D-2_thumb[1]](http://lh3.ggpht.com/_X6JnoL0U4BY/S2uxVOdb8LI/AAAAAAAANNg/MHDKBFxBFNA/tmp9D2_thumb1_thumb.png?imgmax=800)
![tmp9D-3_thumb[1] tmp9D-3_thumb[1]](http://lh5.ggpht.com/_X6JnoL0U4BY/S2uxbZ1ABjI/AAAAAAAANNo/EuIf1djhaow/tmp9D3_thumb1_thumb.png?imgmax=800)
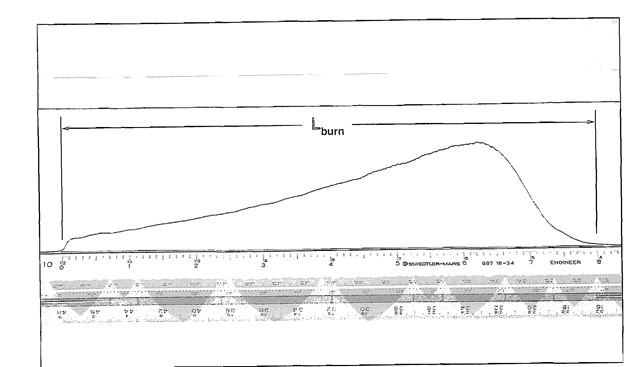
Figure 18-29. The total length of the thrust-time curve is measured from the point at which the pen first began to move, to the point at which it returned to the zero line. In this case the distance is 8.0″.
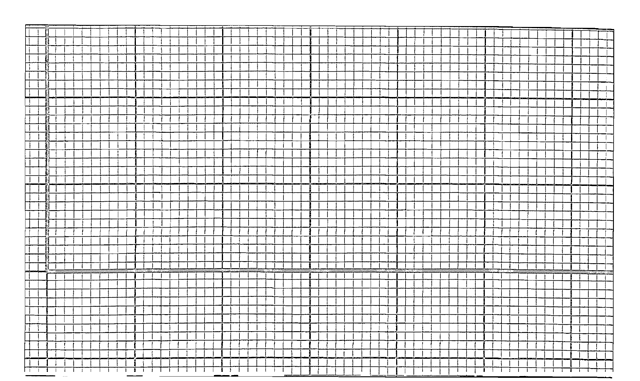
Figure 18-30. A horizontal and a vertical axis are drawn on a sheet of quadrille ruled graph paper, so that they intersect as shown. The paper should he ruled in tenths of an inch.
Total Impulse
Finding a motor’s total impulse is more time-consuming, but well worth the effort if you consider the importance of the data. To find the total impulse, proceed as follows:
MATERIALS LIST
1. A sheet of tracing paper
2. A pen or a sharp pencil (An ultrafine-point “Sharpie” permanent marker works well.)
3. A piece of quadrille graph paper ruled in tenths of an inch (With a simple computer CAD program and a good printer, you can make it yourself.)
1. Draw a horizontal and a vertical axis on a sheet of quadrille-ruled graph paper, so that the\ intersect like the ones in Figure 18-30. The graph paper should be ruled in tenths of an inch. Then carefully trace the chart’s thrust-time curve ( Figure 18-26 ) onto a separate sheet of tracing paper, and be sure to include the zero line and the calibration line.
2. Tape the tracing over the graph paper, so that the thrust-time curve’s zero line falls on the horizontal axis, and the beginning of the burn falls on the intersection of the two axes (Figure 18-31).
3. When viewed through the tracing, each little graph paper square takes on a thrust-time “impulse” value, and you find the motor’s total impulse (I, i by adding up all the squares between the zero line and the thrust-time curve. Bm first you have to know many pound-seconds of impulse each square represents.
4. To find a square’s horizontal time value, count the number of squares between the beginning and the end of the thrust-time curve, and divide the total burn time by the number of squares. In this example the burn time is 2.48 seconds, and in Figure 18-31 there are a total of 80 squares from beginning to end. 2.48/80 = 0.031. Therefore, each square along the horizontal axis has a time value of 0.031 seconds.
5. To find a square’s vertical thrust value, count the number of squares between the chart’s zero line and its calibration line, and divide that number by the calibration weight. In this example the calibration weight is 10 lbs., and in Figure 18-31 there are a total of 21.8 squares between the zero line and the calibration line. 10/21.8 = 0.459. rounded to 0.46. Therefore, each square along the vertical axis has a thrust value of 0.46 lbs.
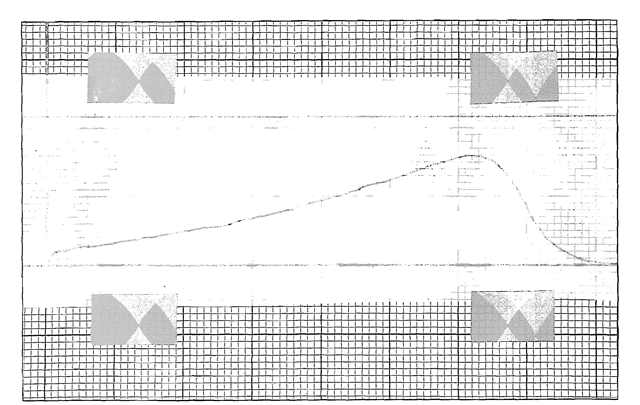
Figure 18-31. A tracing of the motor’s thrust-time curve is taped over the graph paper, so that the zero line falls on the horizontal axis, and the beginning of the bum falls on the intersection of the two axes.
6. To find out how many lb.-sees, of impulse each square represents, multiply the square’s vertical thrust value by its horizontal time value. In this example the answer is 0.46 lbs. x 0.031 sees. = 0.0143 Ib.-secs. Therefore, each square represents 0.0143 Ib.-secs. of impulse.
7. To find the engine’s total impulse (I ). add up all the squares between the zero line and the thrust-time curve, and multiply that number by the impulse value of one square (0.0143 lbs.-secs.). Half squares are added up. and little corners of squares are tallied along with almost-whole ones to arrive at the final figure. In Figure 18-32 I’ve marked them all off. and crossing off large blocks with multiple rows of 10 makes the counting easier. YouTl also see a few vacant spaces. These vacant parts of squares were tallied with other parts of squares until a whole was obtained. One of the parts in the tally was then marked to represent the whole, and you can see that the grand total is 609.
Since each square represents 0.0143 lbs.-secs. of impulse, the total is 0.0143 x 609 = S.71. The motor’s total impulse is therefore 8.71 Ib.-secs. Or translated into metrics (1 lb.-sec. = 4.45 Nt.-secs.). the motor’s total impulse is 38.76 Nt.-secs.
Average Thrust
To calculate the motor’s average thrust in pounds, divide the total impulse (I,) in Ib.-secs. by the total burn time (T).
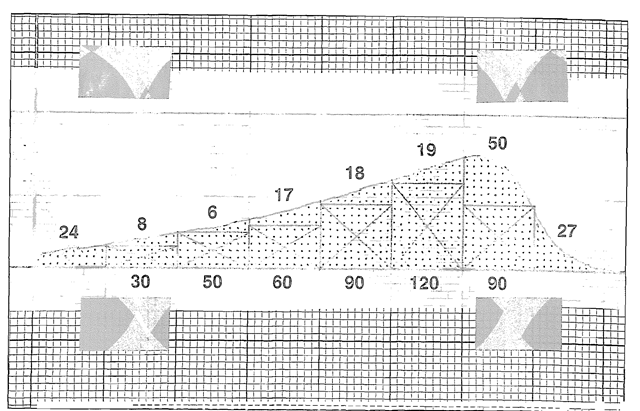
Figure 18-32. The motor’s total impulse is found by adding up all the squares between the chart’s zero line and the thrust-time curve. The numbers below the zero line are the totals for the crossed-out blocks, and the numbers above the thrust-time curve are the totals for the areas above or outside of the blocks. In this case the total is 609.
Propellant Mass
The previous calculations determined four of the motor’s performance parameters, and now uui’re going to find its specific impulse. Specific impulse is important, because, like the gas mileage of a car. it gives you an actual number value for the motor’s operating efficiency, an important thing to know when comparing it to other motor*- of similar design. To do the calculation, you’ll have to know the motor’s propellant mass (m ). and the propellant mass is the exact amount of propellant that you loaded when you made the motor. Important note. The propellant mass includes only the motor’s propellant. It does not include the time delay.
When you made the motor, you weighed out and mixed together specific amounts of propellant and baking soda, and their combined weight equaled the total amount of material in the mixing cup. To find the propellant mass, finish building the motor. Then dry and weigh what remains in the cup. and subtract that weight from the amount you originally mixed.
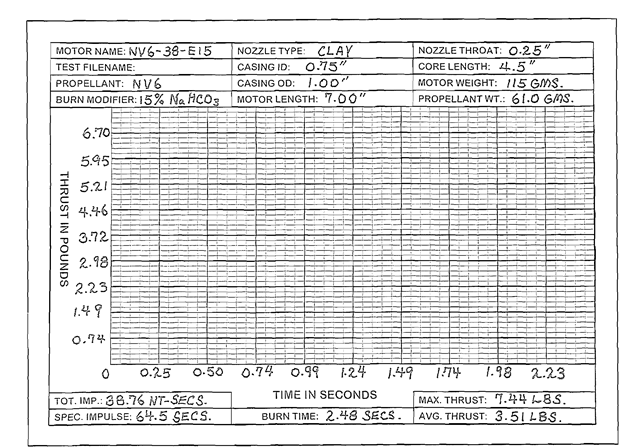
Figure 18-33. To use the blank fonn on page 491. fill in the motor data. Then divide the motor’s bum time and maximum thrust into 10 equal fractions. Round off’the resultant figures to 2 decimal places, and write the appropriate numbers on the grid’s horizontal and vertical axes. When the proper values are in place, then you can manually plot the motor’s thrust-time cu/re.
Specific Impulse
To calculate the specific impulse (I ). divide the motor’s total impulse (I, ) in pound-seconds by its propellant mass (mp ) in pounds. In the English system the motor’s total impulse is 8.71 lb.-secs. In the metric system its propellant mass (mp ) is 61.0 gms. There are 453 grams in a pound, so in the English system the propellant mass is 61.0/ 453 = 0.135 lb.
![tmp9D-9_thumb[1] tmp9D-9_thumb[1]](http://lh4.ggpht.com/_X6JnoL0U4BY/S2u3zAlo_MI/AAAAAAAANOY/KNn2Cwehv5M/tmp9D9_thumb1_thumb.png?imgmax=800)
To transfer a thrust-time curve to the grid, fill in the motor data. Then divide the motor’s maximum thrust and its burn time into 10 parts, round the resultant figures to 2 decimal places, and write those values along the edges of the grid. Figure 18-33 shows how you’d do it for the motor in the previous example. Though there’s no room to write them, the number at the top of vertical axis is assumed to be the Fmax of 7.35 lbs., and the number at the right end of the horizontal axis is assumed to be the T of 2.48 sees. Finally, using the same techniques used to calculate the maximum thrust and the burn time (pages 484 – 486). find the thrust at various time-points along your tracing of the thrust-time curve. Plot those points on the grid, and connect the dots with a pen. Important note. The more points you plot, the more accurate your thrust-time curve will appear.
Equipment Limitations
Useful though it is. this homemade equipment has its limitations, the main one being its inability to record rapid-fire, short-duration changes in motor thrust. The thrust-time curves in topics 11 through 15 show tiny fluctuations that don’t appear on charts generated by the homemade equipment. “Inertia” is the tendency of an object to remain at rest or in a state of uniform motion until acted upon by an external force. During a rocket motor test, inertia expresses itself as a resistance to any change in the current state of motion (or rest) of the motor and the test stand parts. Large changes encounter greater resistance than small ones, so they take longer to occur.
When a rocket motor pushes against a load cell, a movement of one ten thousandth of an inch will appear as a visible feature in the thrust-time curve. Though the event may happen quickly, the motion within the load cell is so small that there’s little resistance, so short-duration events are recorded. To record the same event with a mechanical system, the motor has to push the thrust arm and the pen a hundred times farther, and it takes longer to do it. The result is that short-duration changes in motor thrust begin and end faster than the system can respond, and these events are not recorded.
The second problem with the homemade system is that the motor’s greater motion introduces a large amount of kinetic energy into the system’s moving parts, and this energy has to be dissipated before the pen can come to rest. Large and sudden movements invest the pen with enough energy to make it overshoot its mark when rising, and recoil below the actual value on its return. The oil-filled oscillation damper eliminates most of this excess motion, but to eliminate all of it would require such extensive damping that all but the grossest features in the thrust-time curve would be lost.
The damper described in these instructions is a compromise. It preserves the most important details in the curve, and eliminates all but the most violent overshoot and recoil events. Overshoot and recoil are most prominent in motors with extremely short burn times, and also in warm weather, when the viscosity of the damping oil is lowered. The duct-taped, oil-filled margarine tub is homely and primitive, but it works quite well. If you want something more elegant, experiment with permanently-mounted metal cans, and adjust the diameter of the damping disk to fit.
Finally, though the spring-operated system is reasonably accurate, the locations of the zero and calibration lines will change with the exact weight of the motor being tested. And the force needed to stretch the spring a given distance will change a little with time, temperature, and other factors that tend to be unpredictable. Therefore, you should always recalibrate the stand (i.e. the bucket, the sand, etc.) before every test.
Safety During Motor Testing
When testing rocket motors, you should always be conscious of the danger of setting a fire. Anticipating that the forces opposed to amateur rocketry might try to make an issue of this fact. I’ll point out in advance that commercially made rocket motors often malfunction, and that many fires are started every year by people using commercial}’ made motors in places where they shouldn’t. If you doubt what I’m saying, ask your state firemarshal. The problem is not related to who made the motor, but to whether it is used responsibly.
Acting responsibly means that you only test rocket motors in an area completely free of anything that might burn, including trash, brush, dead wood, dry grass, paper or cardboard, and trees. And even if you don’t see anything flammable, before you conduct a test, walk the area first to be sure. If you find anything flammable within 200 feet of the test stand, remove the flammable material, wet it down with water, or move the test to a more suitable site.
To minimize the danger to yourself, stand at least 25 feet away when testing motors up through E. and 50 to 100 feet away when testing anything larger. If. for any reason you find that you must be closer to the test, protect yourself’with the homemade shield shown in Figure 18-34. It amounts to a sheet of 3/ 8″ thick plywood. 4 feet wide by 5 feet high, hinged to a smaller sheet 4 feet wide by 3 feet high with lightweight chain supports. You can make the entire thing from a single 4′ x 8′ sheet of plywood. To use the shield, place it between you and the motor being tested, and crouch down behind it before you press the firing button. If the motor explodes, the shield will help protect you from sparks and flying debris. Of course an exploding motor can damage the homemade test equipment, so only use the equipment for gathering data. When testing a new propellant.
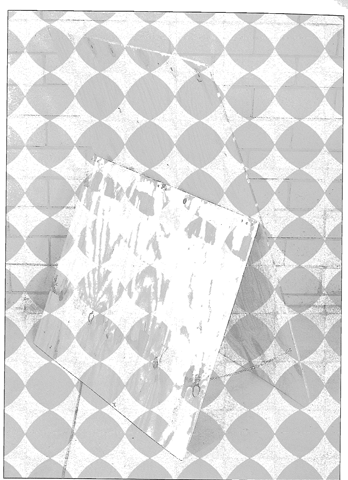
Figure 18-34. If a motor explodes during a test, this simple plywood shield will help protect you from flying debris.
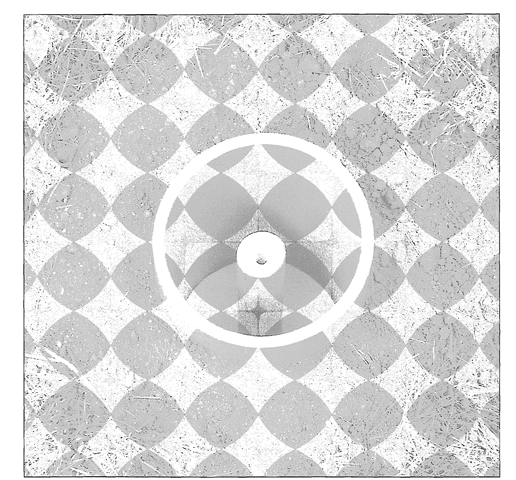
Figure 18-35. Fire clanger during a rudimentary test can be minimized by placing the motor in a 4-inch diameter plastic pipe sunk below ground level. The motor holder is a disk of thick plywood with a hole bored to fit the motor. If the motor explodes, the pipe directs the debris upward, and horizontal spread is minimized.
a new motor design, or a new type of casing, your first concern will be to eliminate “chuffing” (combustion instability), or to verify that the casing can withstand the pressure at which the motor operates. For these simple tests, you don’t need a test stand or a chart recorder. A simple motor-holder will do.
To reduce the fire danger, sink a short length of 4″ diameter PVC or ABS plastic pipe into the ground, and make the pipe go deeper than the longest motor you plan to test. Then mount the motor holder and the motor-to-be-tested in the pipe with the motor’s nozzle an inch or two below ground level (Figure 18-35). The motor holder is a simple disk of thick plywood with a hole bored to fit the motor, and you can add or subtract sand to raise or lower the floor to the depth needed for the motor you are testing. For larger motors, you can stack several layers of plywood together. If the motor explodes, the pipe will direct the debris upward, and minimize its horizontal spread.
Important note. Though Figure 18-35 is black & white, the grass in the photo is mostly-green, and damp from a morning rainstorm. Testing motors immediately after a rain can reduce or even eliminate the danger of setting a fire.
![tmp9D-12_thumb[1] tmp9D-12_thumb[1]](http://lh4.ggpht.com/_X6JnoL0U4BY/S2u4G6cRvuI/AAAAAAAANO4/oanFIcLYGY0/tmp9D12_thumb1_thumb.png?imgmax=800)
