Sedimentation equilibrium experiments measure the radial distribution of molecules at chemical and hydrodynamic equilibrium under a constant centrifugal force (see Centrifugation). This equilibrium distribution is determined by the opposing tendencies of the molecules to sediment and to diffuse (see Sedimentation Velocity Centrifugation). Consequently, the technique permits direct measurement of the molecular weight of the molecule in solution and of Mw and M the weight- and z-average molecular weight distributions (see Analytical Ultracentrifugation). It is also one of the few direct methods, other than titration calorimetry and equilibrium dialysis, for accurately measuring the binding constants between macromolecules.
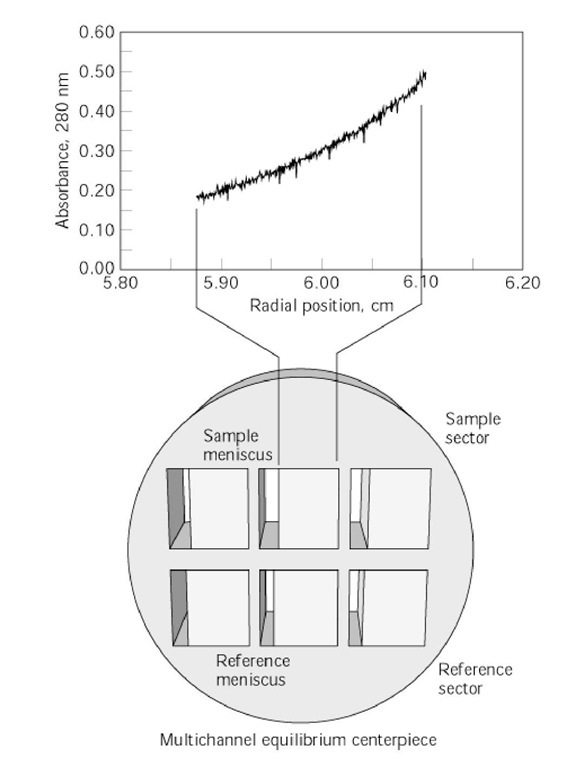
The behavior of an ideal solute at sedimentation equilibrium (Fig. 1) and infinite dilution obeys an exponential (Eq. (1)) relationship and its linear transform (Eq. (2)):
where Cr and Cm are, respectively, the concentrations of the solute at radius r{ and at the meniscus
 is the molecular weight of the solute and v its partial specific volume, w is the angular velocity of the rotor, r is the density of the solvent, R is the gas constant, Tthe absolute temperature, and the C0 term is the combined set of equation constants
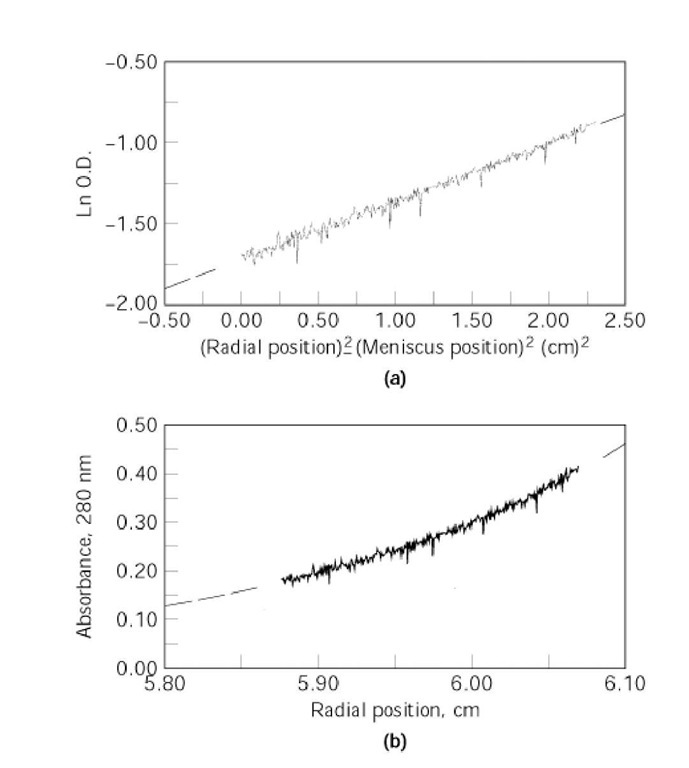
![]() In the linear transform of Eq. 2 (Fig. 2), the apparent solute weight-average molecular weight is defined by the slope of the
In the linear transform of Eq. 2 (Fig. 2), the apparent solute weight-average molecular weight is defined by the slope of the
plot of ln Cr versus . Deviations from linearity are typically caused by solute paucidispersity, polydispersity, and/or nonideality (see Analytical Ultracentrifugation). For most dilute samples of otherwise homogeneous proteins, polydispersity can arise from self-association of solute monomers into larger oligomeric forms or from the dissociation to monomers from a normally oligomeric protein.
Figure 1. Sedimentation equilibrium profile scanned by absorption optics. The raw data are plotted as sample absorbance (sample solution minus reference solution) versus radial distance from the center of rotor rotation. The figure inset depicts the sample and reference channels of the middle of a three-channel centrifuge centerpiece. The sample and reference solution menisci are indicated.
Figure 2. Analysis of sedimentation equilibrium data. In the upper panel, the data for a single sedimenting monodisperse protein are plotted according to Eq. (2) and fitted to a straight line (solid line). The slope of the line is directly proportional to the solute weight-average molecular weight Mw. In the lower panel, the same data are plotted according to Eq. (1), fitting them to a single exponential (solid line).
The distribution of each species in a polydisperse solution during centrifugation is described by an equation of the form of Eq. (1). Rather than dealing with logarithmic transformations of data in Eq. (2), the preferred analysis involves using best-fit exponential sums, as in Eq. (3) (1, 2). For example, at equilibrium, the distribution of total protein concentration between a monomer and a dimer as a function of radial position is described as follows:
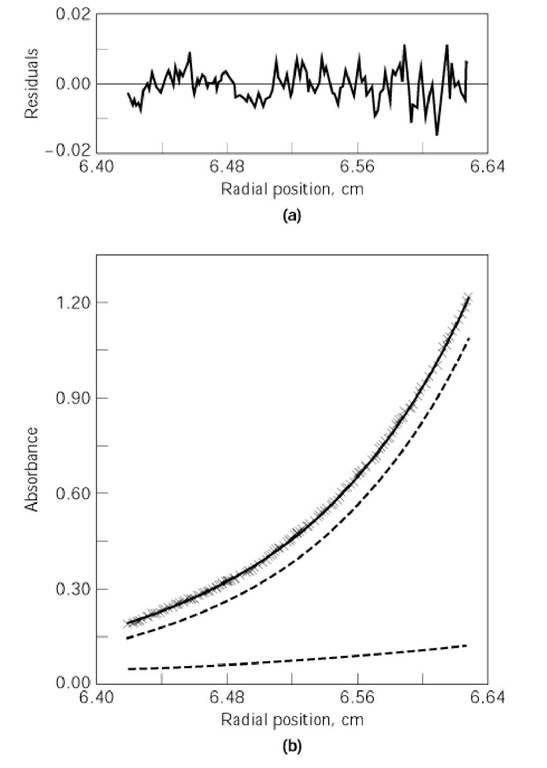
22 where r is the square of the radial position relative to the sample meniscus and (Pr ) is the absorbance at that radial position. The monomer molecular weight (Mw) for the two-term fit, along with the preexponential constants, are allowed to change during data fitting. The fitting routine iteratively adjusts the values of these coefficients to minimize the difference between the observed data and values calculated from the analytical expression. The number of exponential terms employed in the fitting routines is determined by analysis of both goodness-of-fit parameters (usually the chi-square value) and visual examination of the residual differences between the fitted sums and the actual data set. Such a fit is illustrated in Fig. 3. Thus, this analysis permits evaluating the molecular weights and the radial distributions of the components in solution. The radial distributions of the individual species present can be used to calculate binding constants directly for the association of the solution components (3). It can be thought of as combining mass transport (under the influence of the centrifugal field) with equilibrium dialysis (3).
Figure 3. Fit of two exponential terms for a monomer and a dimer to sedimentation equilibrium data for the association of the subunits of cytomegalovirus proteinase (Ref. 4, with permission). Lower panel: raw data (x), fitted exponential sums of monomer (—, lower shallow dashed curve) and dimer (—, upper steep dashed curve). The thick black steep curve passing through the raw data points (x) is the calculated sum of monomer and dimer at each radial position. Upper panel: residual differences between the fitted sum of the two exponential terms and the actual data.
Unlike indirect techniques that correlate changes in solute spectroscopic properties (such as absorbance, fluorescence or circular dichroism ) upon binding, which are often assumed to represent two-state events (free versus bound), sedimentation equilibrium analysis requires no such assumptions. In a carefully performed experiment, both completely bound and free states can exist, literally side-by-side, in the same centrifuge cell. Along with such techniques as isothermal titration calorimetry, where the actual thermochemical energetics of ligand binding are measured, sedimentation equilibrium analysis is one of the few direct techniques capable of such measurements.
![tmp127-132_thumb[1] tmp127-132_thumb[1]](http://what-when-how.com/wp-content/uploads/2011/05/tmp127132_thumb1_thumb.jpg)


