Profiling your applications with Eclipse Test and Performance Tools Platform (TPTP) Project
In the first topic, we have stated that the application code is responsible for about 75% of the performance of the application itself; that way we should consider adding a specific tool which is able to pinpoint hot points and bottlenecks in your code.
The choice of the tool for application profiling was not an easy one for me, mostly because there are actually many good products available in the market. One in particular, JProfiler (an evaluation version is available at: http://www.ej-technologies.com/company/profile.html), has a very intuitive GUI that helps you find performance bottlenecks, pin down memory leaks, and resolve threading issues.
However, in the last few years a new open source profiler platform became popular across Eclipse developers: the Eclipse Test and Performance Tools Project. This project addresses the entire performance life cycle and can be considered the most valuable alternative to commercial profilers. Should you need a product which provides quality support and customer care strategy, you can still switch to JProfiler which requires a small learning curve once you have acquired the correct tuning methodology.
Installing the TPTP suite
In order to use TPTP suite, you need to have Eclipse 3.5.0 (Galileo) or later installed on your PC. If you don’t have Eclipse available you can download it from the following link:
http://www.eclipse.org/tptp/home/downloads/.
Now choose the distribution that’s appropriate for your OS. Once the download is complete, Windows users can simply unzip the eclipse-jee-galileo-win32.zip file, while Linux users can use the tar command to uncompress the .tar.gz archive.
Unzipping the archive will create a root directory named eclipse. In that folder, you will find the Eclipse application (a big blue dot). We recommend you create a shortcut on the desktop to simplify the launching of Eclipse. Running Eclipse is simply a matter of executing the following command from the root directory of eclipse:
Updating Eclipse
At this point you can proceed to install the TPTP suite. Our suggested procedure is by means of the Eclipse Update Manager facility. This has the advantage of avoiding common mistakes when manually installing the packages and also will automatically manage the dependencies by loading all required plugins.
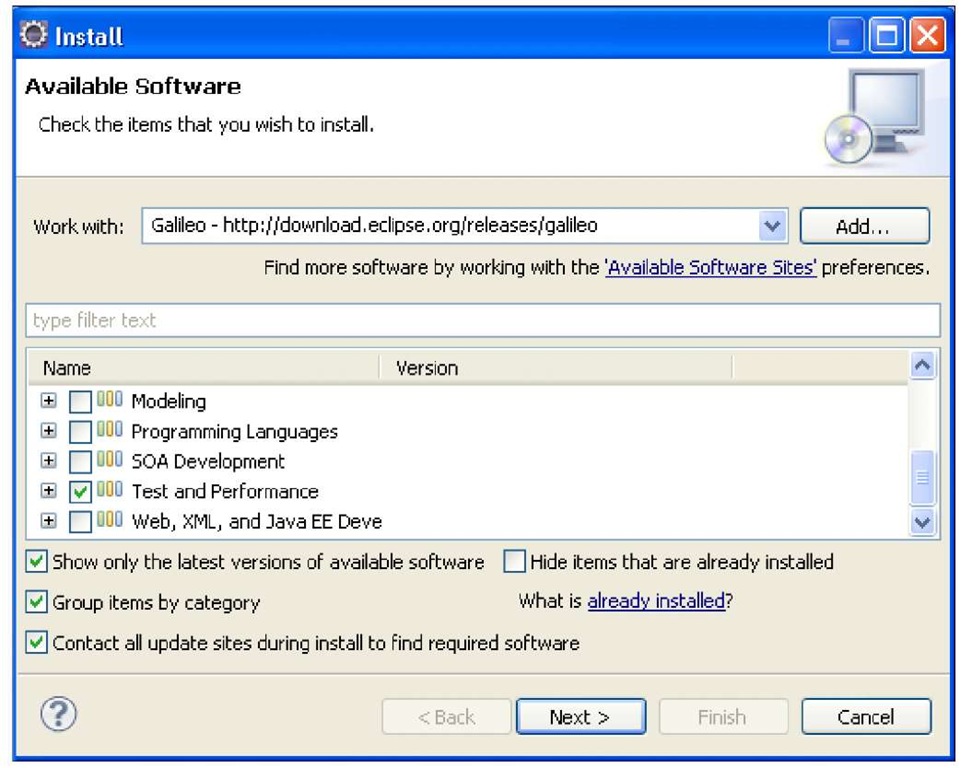
Select from the Eclipse menu from Help | Install New Software. In the next panel, select Galileo from the Work with drop-down list:
Enable Test and Performance and click on the Next button to verify the installation details.
In the Install dialog, click on the Next button to start the installation. Accept the license agreement(s) and click on the Finish button to end the installation. You need to restart Eclipse to acknowledge the changes made so far.
How to profile an application
If the installation was successful you should notice the new "Profiler" icon in the Eclipse toolbar, as shown in the following screenshot:
Profiling an application is pretty intuitive: either select the main class from the Profiler button or simply right-click on a Class and select Profile as | Java Application.
In order to profile components running on the application server, at first define a new server from the File menu: File | New | Server and add a new JBoss or Tomcat server instance.
Then, from the toolbar, launch the profile on the available server, as shown in the following screenshot:
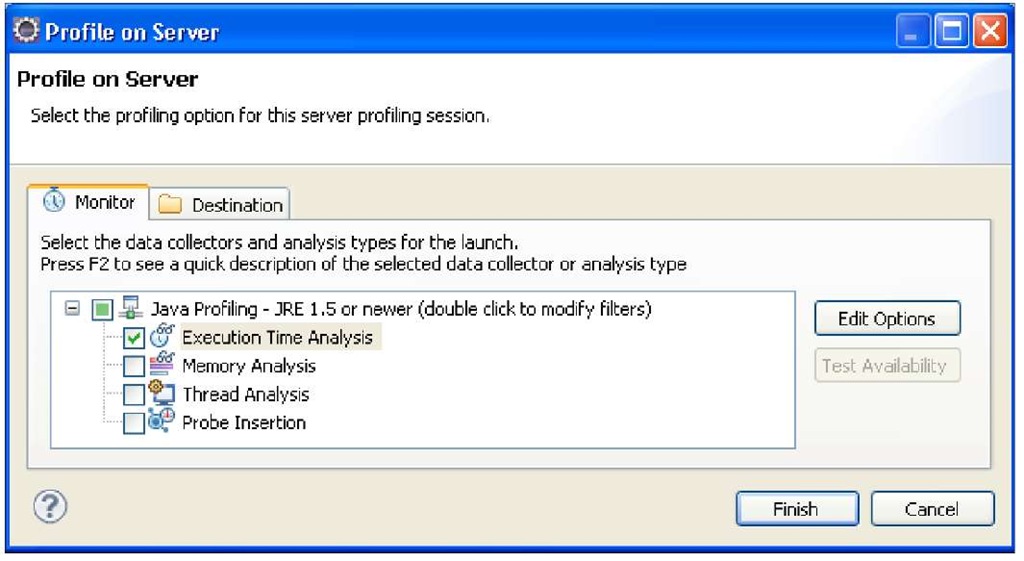
As you start the Profiler, a configuration pop-up will open, which allows you to select which criteria you are profiling your application for:
The current profiler version allows only mutually exclusive analysis types. Therefore only a single analysis type (among Execution Time Analysis, Memory Analysis, and Thread Analysis) is available per profiling session.
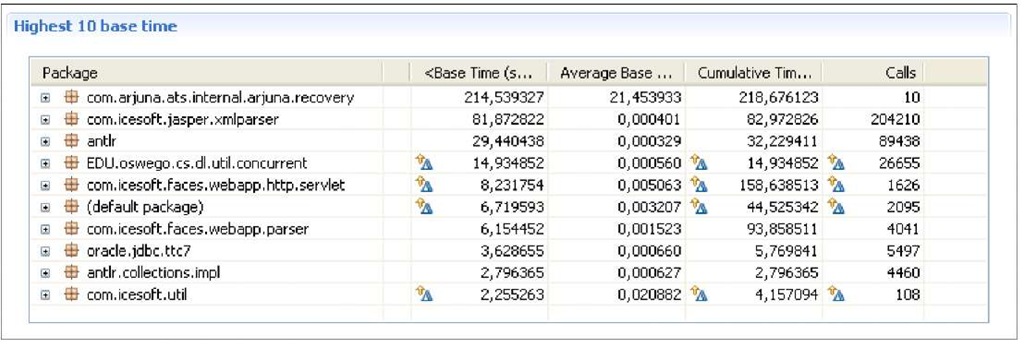
At this point, Eclipse will suggest to switch to the perspective Profiling and Logging. Each profiler analysis contains a set of reports exhibiting different levels of detail on the monitored feature. For example, this is a Summary view of an Execution Time Analysis related to a web application:
Here there are a few statistics about the packages/classes that are displayed in the preceding report. In particular, we are informed about:
• Base Time: The amount of time (in seconds) the method has taken to execute. Not including the execution time of any other methods called from this method.
• Average Base Time: The average base time required to execute this method once.
• Cumulative Time: The amount of time (in seconds) this method took to execute. Including the execution time of any other methods called from this method.
• Calls: The number of times this method was invoked. In order to restrict the area of your analysis, you can set a filter on package/class names.
Profiling the JVM Memory will produce a detailed report about the objects created. The following report shows the Memory Statistics for the same web application:
Notice the information provided in the preceding report:
• Live Instances: The number of instances of a class that are alive (the instances that were not collected by the garbage collector).
• Active Size (bytes): The size of an instance associated with a specific type.
• Total Instances: The total number of instances of the class.
• Average Age: The number of young generation collections survived by the objects.
All the Profiler resources created can be saved for later analysis by right-clicking on the server in the Profiling monitor window and then clicking on Save. You can also generate a report in various different formats (CSV, HTML, XML) by choosing the New Report option in the same menu.
Going beyond the basics of TPTP
The TPTP platform addresses the entire test and performance lifecycle, from early testing to production application monitoring, including test editing and execution, monitoring, tracing and profiling, and log analysis capabilities. In this section, we have covered the basics to get introduced quickly to application profiling. However, to learn more about this great tool you can visit the platform homepage at : http://www.eclipse.org/tptp/
Load testing your application with JMeter
Unless you plan to hire a few hundreds guys to set up a benchmark for your applications, you need to install some tools to automate your testing.
Automated load testing tools became popular in the late 90s to benchmark web applications. Today there’s a vast choice of tools available, most of them are equipped with similar features: our favorite choice is the well known Jakarta JMeter which can be downloaded at the following location: http://jakarta.apache.org/ site/downloads/downloads_jmeter.cgi.
Jakarta JMeter is delivered as a Java standalone application so it requires a JVM installed (1.4 or higher). In order to start JMeter, run the jmeter.bat (for Windows) or jmeter (for Unix) file. These files are found in the bin directory.
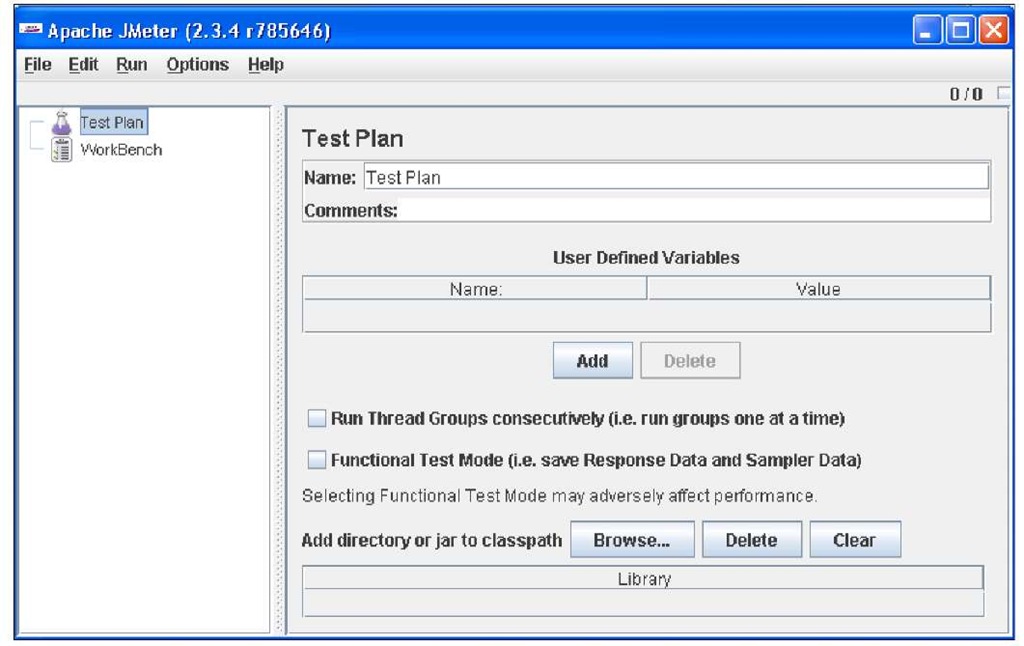
Once the JMeter GUI has loaded, you’ll notice two elements in the left pane: the Test Plan and WorkBench:
The Test Plan is a container for running tests. The WorkBench functions as a temporary workspace to store test elements. When you are ready to test what you have designed in the WorkBench, you can copy or move the elements into the Test Plan.

![tmp39-28_thumb[2][2] tmp39-28_thumb[2][2]](http://what-when-how.com/wp-content/uploads/2011/09/tmp3928_thumb22_thumb.jpg)
![tmp39-29_thumb[2][2] tmp39-29_thumb[2][2]](http://what-when-how.com/wp-content/uploads/2011/09/tmp3929_thumb22_thumb.jpg)


