Results and Discussion
As-Received Stress Measurements
The aluminum exhibited a near-zero and near-uniform as-received surface stress throughout each of the twelve specimens. This is a very good result and exactly what we were looking for in specimen quality. Assuming that the stress distribution is relatively uniform across the longitudinal dimension, we will be able to attribute any change in stress to the parameter variation. Specimens Al-1, Al-2, and Al-3 were used for the parameter variation experiments (Fig. 6). The variation of the as-received stress state between each specimen is small (± 2ksi, ± 13.8 MPa) and will not be corrected for in the results. This follows for the stainless steel as well.
Fig. 6 As-received longitudinal residual stress distribution in aluminum specimens 1, 2, and 3
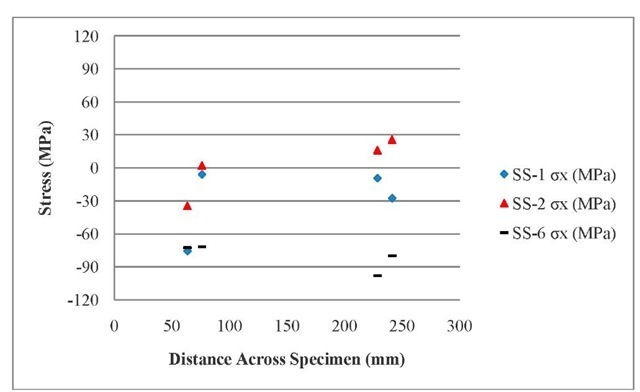
Unfortunately, the 304 stainless steel specimens were found to contain a large, non-uniform surface stress that would serve to corrupt any noticeable effects due to drilling-parameter variations (Fig. 7).
Fig. 7 As-received longitudinal residual stress distribution in stainless steel specimens 1, 2, and 6
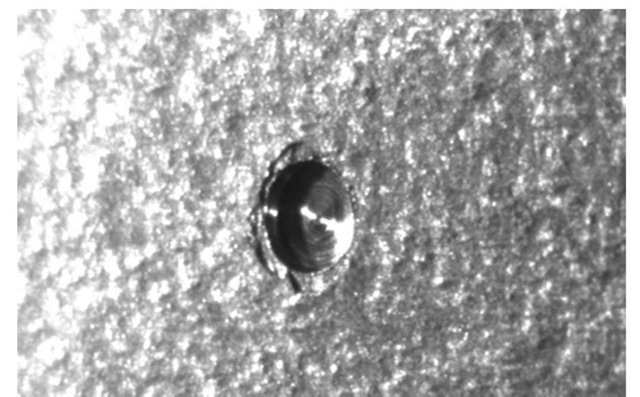
Additionally, the A36 steel specimens had a small (< 0.01") layer of mill scale on the surface which flaked off during drilling and de-correlated the ESPI measurements, making the RS results inconsistent and inaccurate (Fig. 8).
Fig. 8 Surface scale flaking off around perimeter of drilled holes
Annealing of Type 304 Stainless Steel
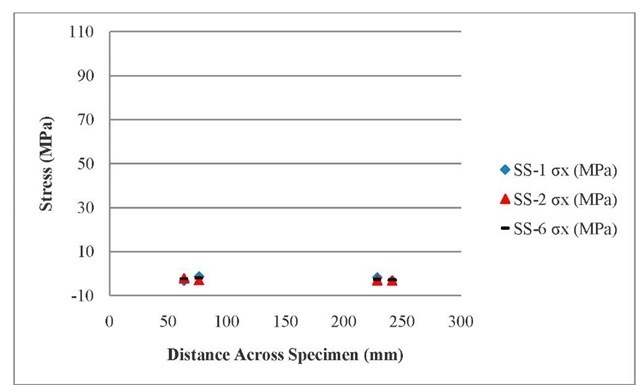
To remedy the large, non-uniform stress field in the 304 stainless steel, each of the specimens were fully annealed. The specimens were treated at 1050° C for 30 minutes, and then allowed to cool slowly in an argon-gas flow-chamber for 3 hours. Afterwards, four more holes were drilled in each of the stainless steel specimens, in the same pattern as the four prior holes, but on the opposite faces. The annealing was shown to both reduce the magnitude of surface stress in each of the specimens and increase uniformity of stress across the specimens’ surfaces (Fig. 9). A thin layer of oxidation was left on the stainless steel specimens from the annealing procedure, but this did not affect the ESPI system’s ability to image their surfaces.
Fig. 9 Post-anneal longitudinal residual stress distribution in stainless steel specimens 1, 2, and 6 Shell-milling of A36 Steel
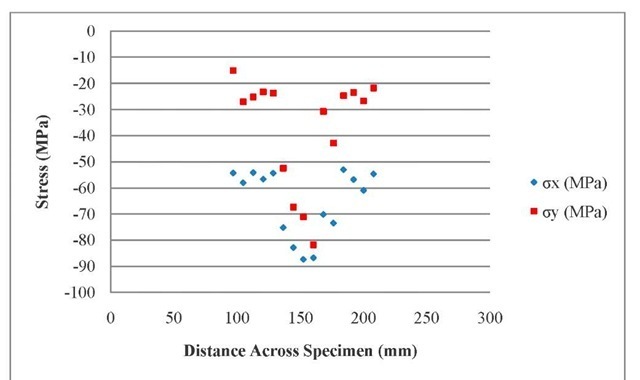
The plain carbon steel specimens were returned to the machine shop to remove the small layer of mill scale present at the surfaces. The faces of each specimen were shell-milled with a 1" carbide-tipped fly-cutter tool to a depth of .01". This reduced the nominal thickness of each carbon steel specimen from .5" to .48". After the milling procedure successfully removed the mill scale another attempt was made at characterizing the state of stress. To preserve the carbon steel specimens by preventing unnecessary drilling in specimens CS-3 through CS-6, the first bar was flipped to the untouched face and four holes were drilled in the same format as the opposite face (Holes 5-8). These measurements showed vast improvement in data quality due to the shell-milling, so the rest of the A36 steel specimens were tested for as-received residual stress. However, it was noticed later on that during the shell milling process, a pass was made with the carbide tool in the center of the longitudinal dimension in the transverse direction of each carbon steel specimen. To identify the effect of this change in milling direction, a set of 15 as-received stress measurements were taken in two A36 steel specimens across this zone. It was identified that for these specimens a large longitudinal stress gradient was present across the center 2" span of the longitudinal dimension (Fig. 10). Therefore, the A36 steel was chosen to be left out of the remaining tests.
Fig. 10 Stress gradient across the longitudinal dimension of A36 steel specimen 3
Drill-Speed vs. Applied Stress
The aluminum samples were subjected to an applied surface stress of 20 ksi (138 MPa) (~48% of yield) corresponding to a .09167" (2.328mm) deflection in the 4-point bend fixture, while stress measurements were taken in various drill-speed intervals. An analysis of the data shows that reducing the drill-speed down to 2K rpm has no noticeable effect on the accuracy of the stress measurement in 6061-T651 aluminum (Figs. 11 and 12). The drilling of the holes gave little to no vibration or noise. The ejected chips at 40K rpm were so small and light that they momentarily hovered in the air. As the speed was decreased they became larger and fell to the table immediately after ejection. This was accompanied by a slight increase in noise during drilling. The measured stress values in aluminum specimen 1 are approximately 2ksi (13.8 MPa) higher than those in aluminum specimen 2 due to the higher as-received stress state. Visual comparison of holes produced in the aluminum at both 40K and 2K rpm show no noticeable difference. Figure 13 displays a hole of acceptable quality produced at 2K rpm.
Fig. 11 Measured stress vs. drill-speed in aluminum specimen 1 with an applied surface stress of 138 MPa
Fig. 12 Measured stress vs. drill-speed in aluminum specimen 2 with an applied surface stress of 138 MPa
Fig. 13 Good quality hole drilled at 2K rpm in 6061-T651 aluminum specimen
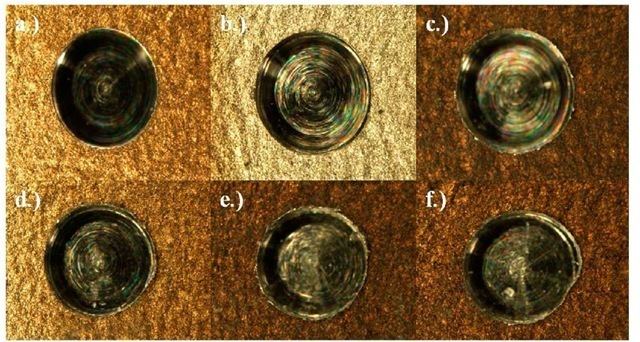
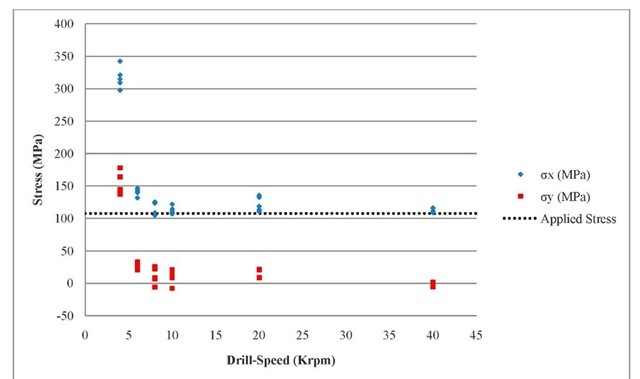
The stainless steel specimens were elastically bent to achieve a centerline deflection of .02591" (0.6581mm), corresponding to a 15.6 ksi (107.6 MPa) (~40% of yield) surface stress. Stress measurement in stainless steel specimen 1showed a stress overestimation that began to occur at and below 6K rpm. Measurements were not obtainable at 2K rpm. Stainless steel is more difficult to machine and this trait manifested itself in the increased noise and vibration as the drill-speed was decreased. Chips ejected from the hole became longer with decreased drill-speed and the holes seemed to lose their quality. This was confirmed to be the case after visual inspection of the holes was performed with a high-resolution, Nikon digital stereoscope. Figure 14 displays holes drilled at speeds of 40K, 12K, 10K, 8K, 6K, 4K, and 2K rpm. The quality of the hole-perimeter begins to decrease at 8K rpm and the results follow suit beginning at 6K rpm. This decrease in hole quality has already been confirmed by Flaman in 1982, but only at 2K rpm. Seeing a side by side comparison of holes drilled at incrementally decreasing speeds gives a good idea of about where the quality begins to affect the results of a given measurement. The measured stress vs. drill-speed results in both stainless steel specimens are given in figures 15 and 16. The overestimation of the stress may very well be due to the reduced hole quality found at lower drill-speeds.
Fig. 14 Holes imaged with Nikon HR stereoscope at speeds of a.) 40K, b.) 10K, c.) 8K, d.) 6K, e.) 4K, and f.) 2K rpm
Fig. 15 Measured stress vs. drill-speed in stainless steel specimen 1 with an applied surface stress of 107.6 MPa
Fig. 16 Measured stress vs. drill-speed in stainless steel specimen 2 with an applied surface stress of 107.6 MPa
Depth/Diameter ratio vs. Applied Stress
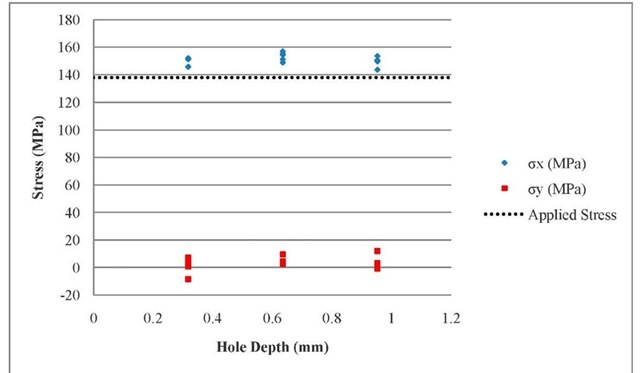
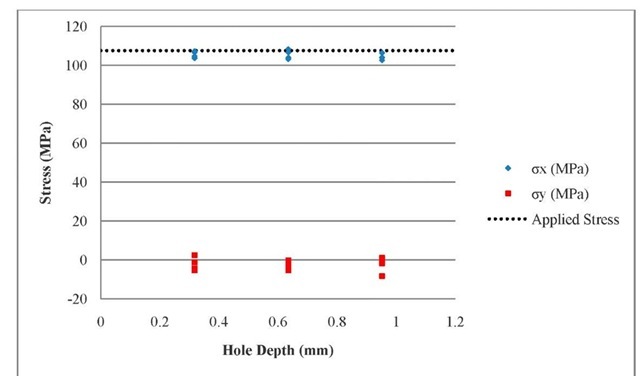
This series of tests was performed to identify any adverse effects to accuracy caused by altering the hole-depth. Specimens were loaded to surface stresses of 20ksi and 15.6ksi for aluminum and stainless steel, respectively. While holding the drill-speed (40K rpm) and bit-diameter (.0625") constant, holes were drilled at depths of .0125" (.318mm), .025" (.635mm), and .0375" (.953mm), corresponding to D/d ratios of 0.2, 0.4, and 0.6 respectively.
Good results were achieved at all depths for both the aluminum and the stainless steel. The results for the depth variation are given in figures 17 and 18.
Fig. 17 Stress Measured stress vs. hole-depth in aluminum specimen 3 with an applied surface stress of 138 MPa
Fig. 18 Measured stress vs. hole-depth in stainless steel specimen 6 with an applied surface stress of 107.6 MPa
Drill-Bit Diameter vs. Applied Stress
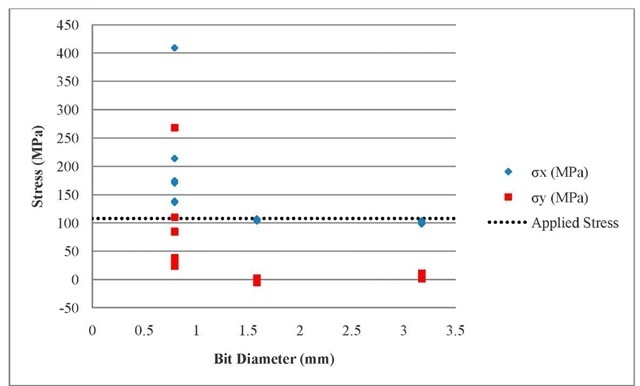
Drill-bit diameter was varied while the D/d ratio and drill-speed was held constant at 0.2 and 40K rpm, respectively. Aluminum gives good results for all three bit sizes. One issue with the stainless steel exposed itself when drilling with the smaller, .03125" diameter bit. The results for this series of holes were very scattered ranging from 20 to 50ksi (138 to 345 MPa) for the longitudinal component and from 3 to 40ksi (20.7 to 276 MPa) for the transverse component. These results don’t seem to be due to any operator error or data corruption. Since the aluminum results behaved well when a .03125" bit was used, this points to the problem being caused by a characteristic of the stainless steel. Since the elastic modulus is much higher in stainless steel, there may not be enough surface displacement when using the .03125" bit. The test results are given in figures 19 and 20.
Fig. 19 Measured stress vs. bit-diameter in aluminum specimen 3 with an applied surface stress of 138 MPa
Fig. 20 Measured stress vs. bit-diameter in stainless steel specimen 6 with an applied surface stress of 107.6 MPa
Conclusions
Good results are possible at speeds between 2K and 40K rpm for 6061-T651 aluminum. Visual inspection shows no noticeable drop in hole-quality with reduction in drill-speed. Good measurements were obtained for all tests in the aluminum specimens with all measured values within ±3 ksi (±20.7 MPa) of the calculated values. This is within the error and uncertainty of the ESPI/hole-drilling instrument.
Good results are obtainable between speeds of 8K and 40K rpm for 304 stainless steel. While reducing drill-speed in the 304 stainless specimens, a noticeable decrease in machining quality was observed. These ill effects, including very intense noise and vibration along with reduction in hole-quality, may be the mechanism by which the stress is being overestimated in holes produced at speeds < 6K rpm.
Good results in both 6061-T651 aluminum and 304 stainless steel are maintained even as hole-depth is varied. No change in measurement quality is observed when vary bit-size in the 6061-T651 aluminum. Inaccurate and inconsistent measurements obtained in the stainless steel when using a .03125" diameter bit may be caused by a lack of deformation due to the high modulus combined with the reduction in removed material. This acts to decrease the signal to noise ratio and render the data useless.
Future Suggested Work
More testing should be conducted to see at exactly what drill-speed residual stress measurement accuracy and repeatability begins to decrease for a broader range of commonly used engineering materials. This will help aid the residual stress community in choosing the proper parameters and tools for a given material.

