A sustainability framework tailored for transportation and applied to Sydney, Australia
CUSCCRR (Coalition of Urban Sustainability & Climate Change Response Research) Urban transport system characteristics and system vulnerability provide the basis for a climate change scenario in the context of a sustainability framework as shown in Box Figure 6.8. Climate change impacts are drawn in from physical infrastructure characteristics, network relationships, and behavioral changes, which can vary for different cities. The sustainability metrics incorporate the capability to mitigate and resilience for adapting to climate change impact.
Sydney, Australia, is used to illustrate and visualize the metrics and the environmental sustainability measure (Pillar 1), formulated from known fuel consumption of vehicles (see Cosgrove, 2003, p. 342) with speed and used to calculate carbon dioxide equivalent (CO2-eq) footprints for motor vehicles between each trip origin/destination pair.
Sydney’s transport system primarily consists of tolled motorways, arterial roads, and an extensive suburban heavy rail system with a heavy reliance on cars in the suburbs. Estimated annual transport greenhouse gas emissions for Sydney Metropolitan area rose from 9.8 million tons in 1990 to 12.2 million tons in 2001, and emissions are forecast to rise to 16.8 million tons by 2020 on current trends. Car usage contributes 67 percent of these emissions (www.bitre. gov.au/publications/93/Files/r107.pdf, Tables 3.13 and 3.14, accessed August 18, 2009).
Box Figure 6.8: A sustainability framework – tailored for transport infrastructure.
A quantifiable measure of greenhouse gas mitigation effectiveness was developed from detailed operational methods, using transport planning building block techniques.The scenario is based on the combination of two concepts, accessibility and environmental sustainability.
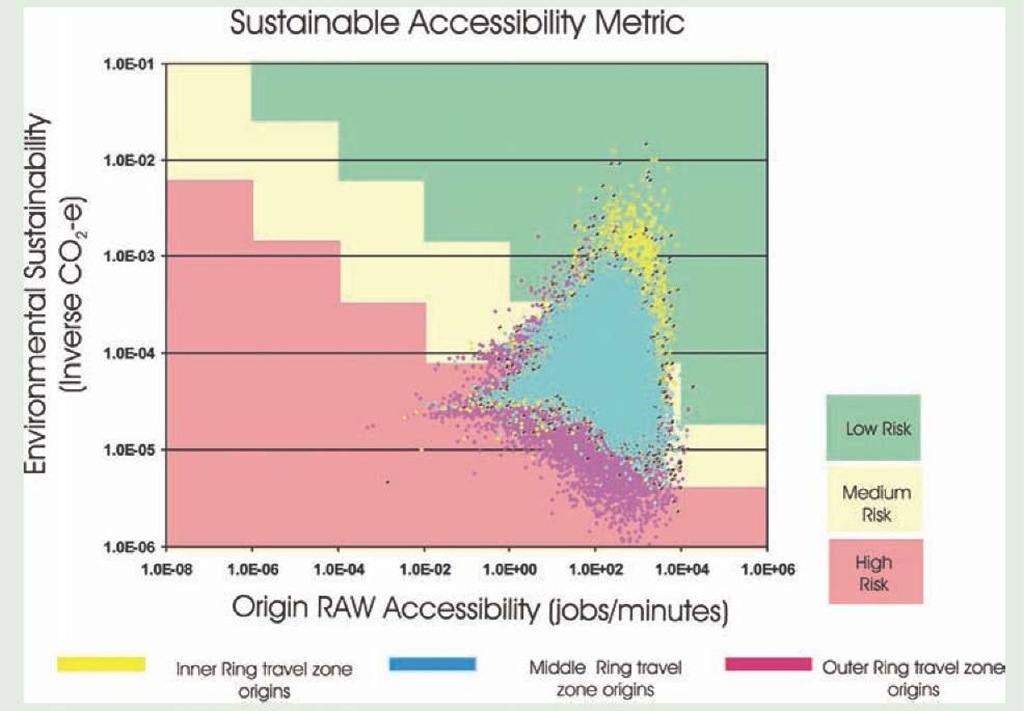
Accessibility has been identified as a useful measure in social and economic aspects of sustainability (see Expert Group on the Urban Environment, 1996; Warren Centre for Advanced Engineering, 2003; Kachi et al., 2005, 2007). In the Sydney Case Study, accessibility measures were derived for each travel zone pair. Separate operational methods were developed to generate worker and employer focused accessibility measures. These are measures that are relatable to social equity (Pillar 2) and economic efficiency (Pillar 3) respectively.
Environmental sustainability measure is defined as the inverse of CO2 emissions from the total Journey to work trips between zone pairs, including an allocation of emissions from manufacture of vehicle and road infrastructure. This is calculated as a sum of the CO2-eq per unit trip km at the average speed with the shortest path trip length and number of trips. The CO2-eq is calculated as the sum of the quantity of greenhouse gas and the Global Warming Potential Index.
These metrics can also be applied in a way that expresses sustainability performance in terms of sustainability risk. High risk, where sustainability performance is poor, is indicated by low metric values. Low risk, where sustainability performance is satisfactory, is indicated by a higher metric value, above a community accepted minimum target. The grid concept can be likened to a risk matrix allowing each zone pair to be assigned a sustainability risk rating (Box Figure 6.9). The sustainability risk boundaries are specific to each city, and influenced by the population’s estimated resilience.
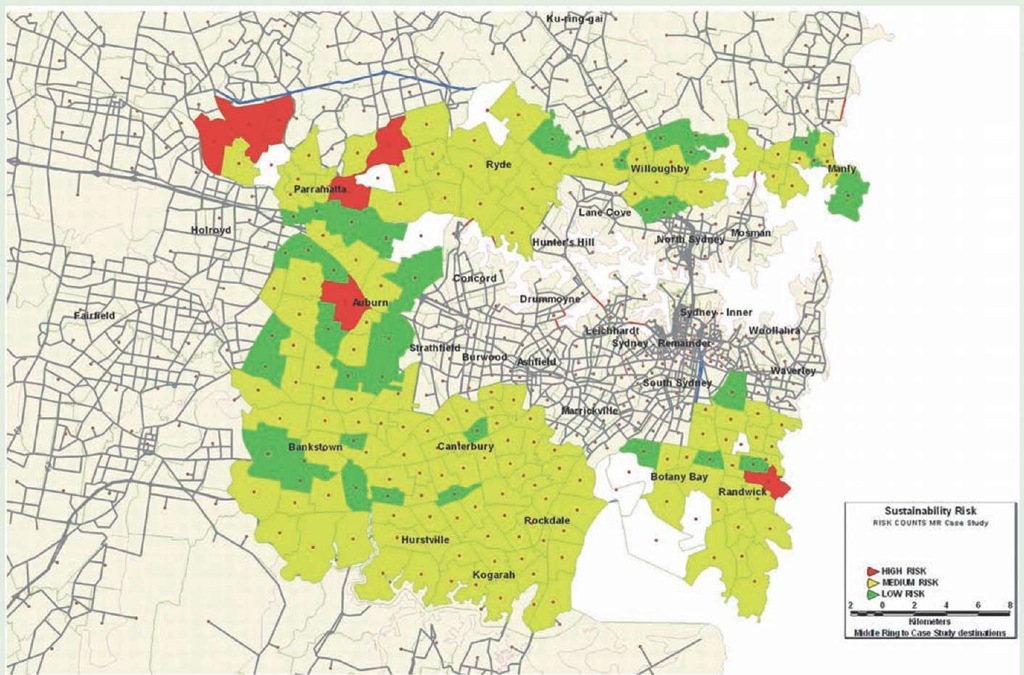
This sustainability risk rating can then be plotted onto geographic space using geographic information system (GIS) thematic mapping. Box Figure 6.10 illustrates such a visualization in geographic space.
Each of these visualizations provides insight into the position, spread, and internal distribution trends for a city’s urban sustainability pillars of environmental stewardship, social equity, and economic efficiency. For community and decision-makers these visual differences give a simple snapshot of overall sustainability performance for each scenario being considered. It is straightforward to change the scenario, use the building block techniques, and produce a new metric plot to see the sustainability effect of the policies embedded in the scenario. Stakeholders can see measurable change for their communities in relation to sustainability goals. The process provides another dimension to visioning and sustainability strategy development by adding the means by which a community can measure and judge one infrastructure and urban form scenario with another.
Box Figure 6.9: Sustainability performance risk overlay to Sydney Inner, Middle, and Outer Ring results in 2001.
Box Figure 6.10: Sustainability risk rating plotted onto geographic space.
A particular strength of using the sustainability framework, and the metrics demonstrated here, is that they are derived from data sets that have been commonly used by urban and regional planners for many years. Visualizations of this type can be used to inform decision-makers (community and government agencies) in the process of choosing climate change policies and programs for a city.
Under climate change, scenario systems are also at risk of failure. The current process of determining the metrics under an operational system state is to be extended to also estimate the metrics under failed system states due to transport infrastructure system vulnerabilities to climate change impact. The methodology discussed in this case study provides a useful tool for each city beginning to understand how they should respond to climate change. Every city will have its own unique set of urban response scenarios to choose from in mitigating greenhouse gases, and each of these will need to occur in a future that does involve adaptation to climate change impacts of some degree. The more there is understanding of the effectiveness of each of these urban response scenarios, inclusive of the adaptive capability, in balance with other sustainability pillars, the greater the likelihood of real outcomes being realized for each of our cities.
This Case Study is based on the original research titled "Metrics of Environmental Sustainability, Social Equity, and Economic Efficiency in Cities" Doust, K. (2008). Papers from this research have been published in the following peer reviewed journals and conference proceedings: Black and Doust (2008); Black et al. (2010); Doust (2010); Doust and Black (2008); Doust and Black (2009); Doust and Parolin (2008); Doust and Parolin (2009); Nakanishi et al. (2009).


