New York City, United States
With 8.2 million people, a $1.1 trillion GDP (Bureau of Economic Analysis, 2008) and an operating budget of over $40 billion, New York City is the largest city in the USA both in population and in economic productivity (The City of New York, 2007, 2009). The distribution of wealth within the city, however, has been described as an "hourglass economy," where there is a shrinking of the middle class and growth in both the upper- and lower-income populations.
New York City is an archipelago with five boroughs spread out over three islands – Long Island, Manhattan, and Staten Island – and the mainland of the USA. New York is one of the world’s most important international financial hubs. As a coastal city, most of New York City sits at a relatively low elevation with approximately 1 percent of the city lower than 3 meters (10 feet).Much of Manhattan’s very low-lying land is home to some of the most important economic infrastructure in the world.
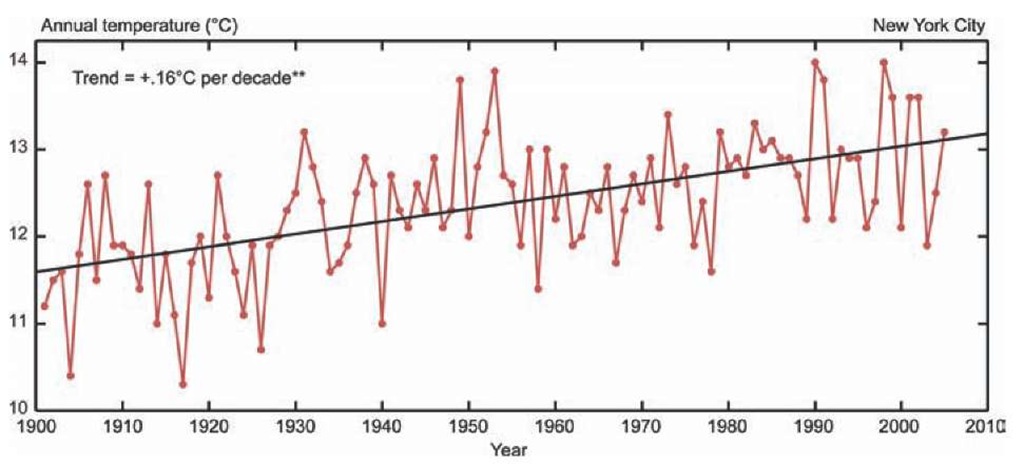
New York City has a temperate, continental climate characterized by hot and humid summers as well as cold winters and consistent precipitation year round. Using a baseline period of 1971-2000, records show an average temperature of 12.7 °C with precipitation averaging 109 to 127 centimeters per year. Recent climate trends show an increase in average temperature of 1.4 °C since 1900 and a slight increase in mean annual precipitation (New York City Panel on Climate Change (NPCC), 2009) (see Figures 2.16 and 2.20).
Hazards and vulnerabilities
New York City is susceptible to mid-latitude cyclones and nor’easters, which peak from November to April. These storms contribute greatly to coastal erosion of vital wetlands that help defend areas of the city from coastal flooding. Tropical cyclones (hurricanes) also have the potential to reach New York City, usually during the months of August and September. There is some indication that intense hurricanes will occur more frequently in the future, but this is an area of active scientific research.
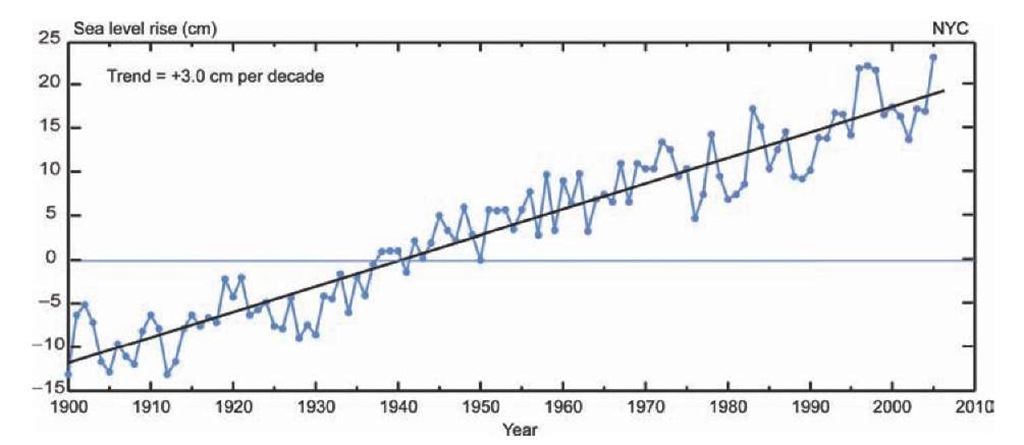
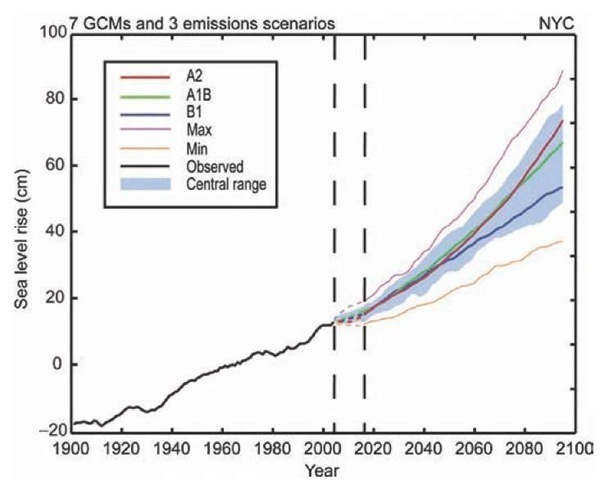
Based on climate model projections and local conditions, sea level is expected to rise by 4 to 12 centimeters by the 2020s and 30 to 56 centimeters by the 2080s (see Figures 2.18 and 2.19); when the potential for rapid polar ice-melt is taken into account based on current trends and paleoclimate studies, sea level rise projections increase to between 104 and 140 centimeters (NPCC, 2009). The possibility of inundation during coastal storms is greatly enhanced with the projected effects of sea level rise.
Figure 2.16: Observed temperatures, New York City.
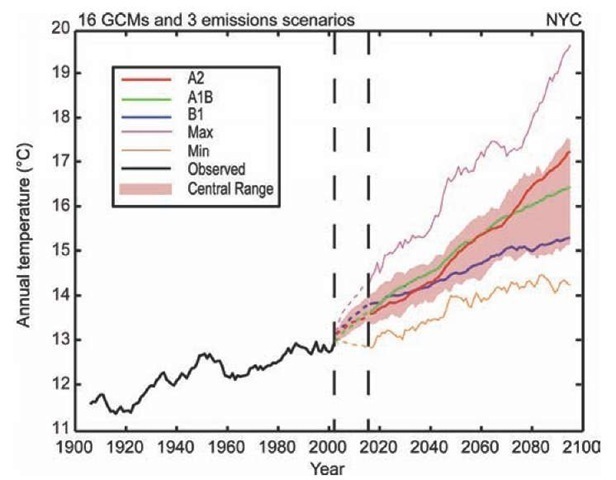
Another hazard to impact New York City as a result of climate change is rising mean temperature, along with the associated increase in heat waves. The annual mean temperature in New York City has increased nearly 2 °C since 1900 (NPCC, 2009). Climate models predict that the average temperature will increase by between 1 and 1.5 °C by 2020 and 2 to 4 °C by the 2080s as seen in Figure 2.17 (NPCC, 2009). As defined by the New York Climate Change Task Force, a heat wave is any period of three straight days with a temperature over 32 °C. The frequency of heat waves is projected to increase as the number of days over 32 °C increases. These higher temperatures will also intensify the urban heat island in New York City, since urban materials absorb radiation throughout the daytime and release it during the night, causing minimum temperatures to rise.These sustained, higher temperatures exacerbate the effects of heat on humans (Basu and Samet, 2002).
Inland floods and droughts are two more hazards that confront New York City. Climate models indicate that precipitation in New York City is likely to increase by up to 5 percent by the 2020s and between 5 and 10 percent by the 2080s, as seen in Figure 2.21 (NPCC, 2009).
Figure 2.17: Projected temperatures, New York City.
These increases are projected to come in the form of more intense rain events. This means more days without precipitation between larger and more intense storms. As extreme rain events are expected to increase in intensity while decreasing in frequency, many of the rivers and tributaries that flow through New York City and feed into the bodies of water that surround the city may breech their banks more frequently, as they will likely be unable to handle the volume of water flowing into them as runoff.
Droughts may also prove to be a hazard as a result of climate change if the period between rain events increases. A major concern is the New York City water supply, which is drawn from up to 100 miles north of the city. The higher levels of precipitation associated with climate change are expected to be offset by the greater rates of evaporation associated with temperature increase, thus increasing the likelihood of drought (NPCC, 2009).
The impacts of these climate hazards are interconnected and affect many systems in New York City differently but simultaneously. Roadways and subways, as well as ferry ports, industries located along the coast, and wastewater treatment facilities are susceptible to inundation. More hot days will increase electricity demand to run cooling systems, thereby increasing CO2 emissions. The erosion of natural defenses such as coastal wetlands increases the likelihood of flooding of nearby neighborhoods and industries.
Some populations are more vulnerable than others and these vulnerabilities are frequently differentiated along the lines of inland versus proximity to coast, young versus old, and rich versus poor. One key climate change vulnerability is related to air quality and human health, since degradation of air quality is linked with warmer temperatures. The production of ozone (O3) and particulate matter with diameters below 2.5 micrometers (PM2.5) in the atmosphere is highly dependent on temperature.Therefore, increased temperatures are likely to make managing these pollutants more difficult. Both of these pollutants affect lung functioning, with higher ozone levels being associated with increased hospital admissions for asthma.
Figure 2.18: Observed sea level rise, New York City
Further, the elderly and those suffering from heart- and lung-related diseases have been shown to be more susceptible to the effects of heat, often resulting in death from heat stroke and heat-related causes (Knowlton et al., 2007).
New York City is vulnerable to heat waves and, as an archipelago, is particularly vulnerable to the effects of storm surge as a result of sea level rise. Projected sea level rise of 30 to 58 centimeters – or 104 to 140 centimeters, if rapid polar ice-melt is considered – is not expected to inundate the city extensively; rather, the problem emerges when larger storms such as the 1-in-100 year storm, which are expected to become more frequent, produce a greater storm surge that will likely cause damaging floods (NPCC, 2009) (see Figure 2.22).
Certain populations are more vulnerable to the effects of heat and higher sea levels. Approximately 967,022 people in New York City are aged 65 or older and of those it is estimated that 43 percent are living with some sort of disability (US Census Bureau, 2008).
Figure 2.19: Projected sea level rise, New York City.
These two factors contribute to the extreme vulnerability to heat of the elderly (Basu and Samet, 2002). According to the Department of Health for the City of New York, during the heat wave of 2006 over half of those who died in New York City were over age 65 and all but five people were known to have suffered from some type of medical condition (Department of Health and Mental Hygiene (DOHMH), 2006).
New York City is a densely populated city with approximately 10,380 people in each of its 305 square miles or 790 square kilometers (Department of City Planning, 2009). Within this area there are clear pockets of wealth and poverty. The areas of low per capita income are in northern Manhattan, above Central Park, the borough of the Bronx and parts of Brooklyn. Sea level rise and coastal flooding are concerns for certain parts of these areas including Coney Island, Brighton Beach, and Jamaica Bay. One of the more recurring vulnerabilities for these populations is extreme heat and the diminished air quality that accompanies the heating trend that New York City has seen over the last 100 years and that is projected to continue. The US Census Bureau has estimated that for the period 2005-2007 about 20 percent of the people in New York City were living below the poverty line as established by the US Government (US Census Bureau, 2008). During the heat wave of 2006, 38 of those who died of heat stroke did not have functioning air conditioning in their apartment (DOHMH, 2006).
Adaptive capacity: current and emerging issues
The environment in which New York City makes climate change adaptation and mitigation decisions is highly complex. Due to shared regional transportation, water, and energy systems, the stakeholders in any decision include numerous local governments, multiple state governments, businesses, and public authorities.
The foundation for tackling the challenges of climate change in New York City began in the mid 1990s when the New York Academies of Science published The Baked Apple? Metropolitan New York in the Greenhouse in 1996. Shortly thereafter, the Earth Institute at Columbia University, through the Center for Climate Systems Research (CCSR) released Climate Change and a Global City: The Potential Consequences of Climate Variability and Change.
Figure 2.20: Observed precipitation, New York City.
This report covered the Metro-East Coast Region and served as the first assessment of climate change and cities in the USA. In 2008, CCSR worked with the New York City Department of Environmental Protection to develop a sector-specific climate assessment and action plan for New York City’s water system (New York City Department of Environmental Protection, 2008).
The New York City administration through its Office of Long-Term Planning and Sustainability created the NYC Climate Change Adaptation Task Force in 2008, which is now working with local experts, city departments, and stakeholders to develop a comprehensive, integrated climate change risk assessment and adaptation plan for the critical infrastructure of the metropolitan region. The NYC Climate Change Adaptation Task Force is made up of representatives from over 40 city and regional departments and industries. The city administration also convened the New York Panel on Climate Change (NPCC) to provide expert information about climate change risks and adaptation.
Figure 2.21: Projected precipitation, New York City.
The NPCC is made up of climate change scientists and experts from the legal field, insurance, telecommunications, and transportation, and has provided the climate risk information needed to create actionable guidelines and plans for adapting the city’s critical infrastructure for the projected effects of climate change (NPCC, 2009). The NPCC has also worked with the NYC Climate Change Adaptation Task Force to develop a common set of definitions for adaptation assessment.
The next step is to begin planning and making specific adaptation investments across the city. In the past in New York City, this has tended to be on a project basis and so has been less coordinated across sectors. Having brought decision-makers from all key departments in the city and from numerous sectors, the New York City climate change adaptation process is helping to facilitate more open avenues of communication and coordination within and among departments.


