Geoscience Reference
In-Depth Information
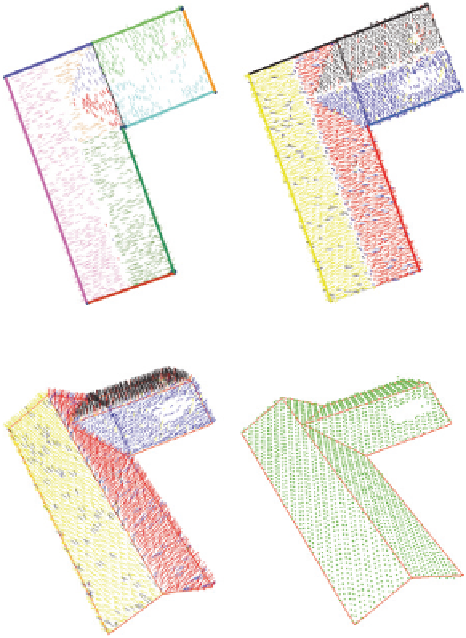
Fig. 3
Classification of a
surface normal respectively
to one side of the building
(
left
), reduction of the classes
to the distinctive sides of the
building (
right
)
Fig. 4
Intersection lines
per color-coded class (
left
),
overlay of the surfaces with
the laser points (
right
)
maximum distance for the classification of a surface normal to a side of the build-
ing must not be longer than the shortest length of both adjacent sides. In Fig.
3
the
front of the saddle roofs with the dark red and light brown classes are omitted.
Common line sections should be merged, points which are on a line have to be
deleted. In Fig.
3
(left) the light green and the violet lines are merged to a black
line (Fig.
3
, right) and assigned to the black class.
A further class reduction can be done by the assignment of the surface normal
to the lines of the building ground plan beyond the side of the building. For exam-
ple the olive colored and light brown normals in Fig.
3
can be assigned to the red
class, the red and light blue normal can be merged to a dark blue class. At the end
we get 4 color coded classes.
After the reduction of the classes an arithmetic mean is calculated for all sur-
face normals of each class. By means of mathematical methods of the descriptive
geometry the intersections of the surface normals are calculated. The ridge lines
are calculated from intersections between the saddle roofs. The eaves respectively
the eaves heights are calculated from intersection of the roofs surface normals with
the building walls surface normals. The result is an automatically derived vec-
tor model, consisting of four areas. Figure
4
shows the classified and color-coded