Geoscience Reference
In-Depth Information
90°N
200
200
200
200
60°N
240
240
240
240
240
30°N
280
240
280
280
Equator
280
240
240
240
280
30°S
240
240
240
60°S
200
200
200
160
160
160
90°S
0°
30°E
60°E
90°E 120°E 150°E 180° 150°W 120°W 90°W 60°W 30°W 0°
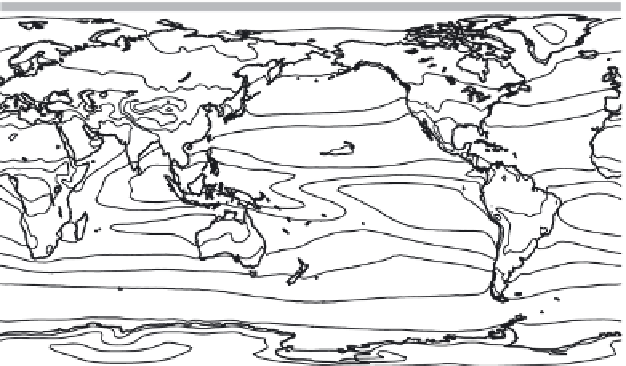
Figure 5.8 The annual mean OLR climatology (W/m
2
).
(a)
90°N
-120
-120
-120
-80
60°N
-80
-80
-40
-40
-40
0
0
0
30°N
0
0
40
40
0
40
40
40
Equator
40
40
30°S
0
0
0
-40
-40
-40
60°S
-80
-80
-80
-80
-120
90°S
0°
30°E
60°E
90°E
120°E
150°E
180°
150°W 120°W
90°W
60°W
30°W
0°
-120
(b )
-80
-80
-40
-40
0
0
0
0
0
40
40
0
40
40
40
40
40
40
0
0
0
0
-40
-40
-80
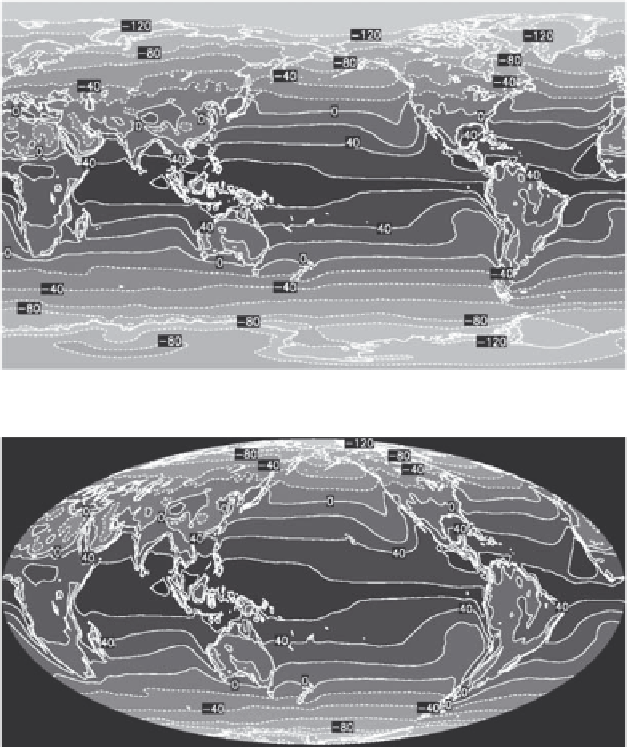
Figure 5.9 Net radiation at the top of the atmosphere in (a) equidistant cylindrical
and (b) Mollweide projections. Contour intervals are 20 W/m
2
.