Geoscience Reference
In-Depth Information
In the global mean, the net radiative heating is zero for an equilibrium cli-
mate (Eq. 5.8), but it is hard to believe that when examining
Figure 5.9a
be-
cause the projection enlarges the surface area at high latitudes. The
Mollweide
projection
shown in
Figure 5.9b
plots surface area accurately and shows more
clearly that the
radiation surplus
in the tropics balances the
radiation deficit
in
high latitudes.
Given the distribution of the net radiative heating at the top of the atmo-
sphere shown in
Figure 5.9,
how is it that the tropical climate is not constantly
warming with time, and the high latitude climate cooling? Why is the climate
system (relatively) stable in the presence of large net radiative heating in the
tropics and radiative cooling at high latitudes at the top of the atmosphere?
The answer is that heat is redistributed within the climate system by atmo-
spheric and ocean circulation systems.
OBSERVED DISTRIBUTION: SURFACE
For the climatology, with no temperature trend, and combining the terms that
represent the redistribution of heat within the land or ocean surface, we can
rewrite Eq. 5.22 as
0
=+−−−−
S
F THHF
εσ
4
(5.29)
ABS
BACK
S
S
L
SFC
where
S
=−
(1
α
)
S
and
F
=+
F
F
.
ABS
S
INC
SFC
HV
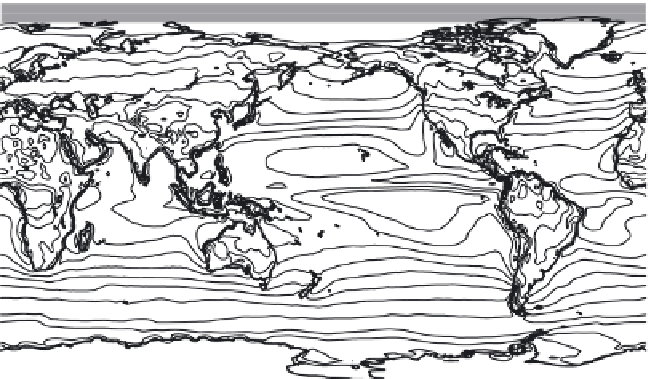
to four times greater than those near the poles. This difference is partly due to the
decrease with latitude of the solar flux incident at the top of the atmosphere (
Fig.
90°N
60
60
60
60
60°N
120
120
120
120
180
180
180
30°N
180
180
180
180
240
Equator
180
240
240
30°S
180
180
180
180
180
180
120
120
120
120
60°S
60
60
60
60
90°S
0°
30°E
60°E
90°E 120°E 150°E 180° 150°W 120°W 90°W 60°W 30°W 0°
Figure 5.10 Solar radiation absorbed at the surface. Contour intervals are 20 W/m
2
.