Geoscience Reference
In-Depth Information
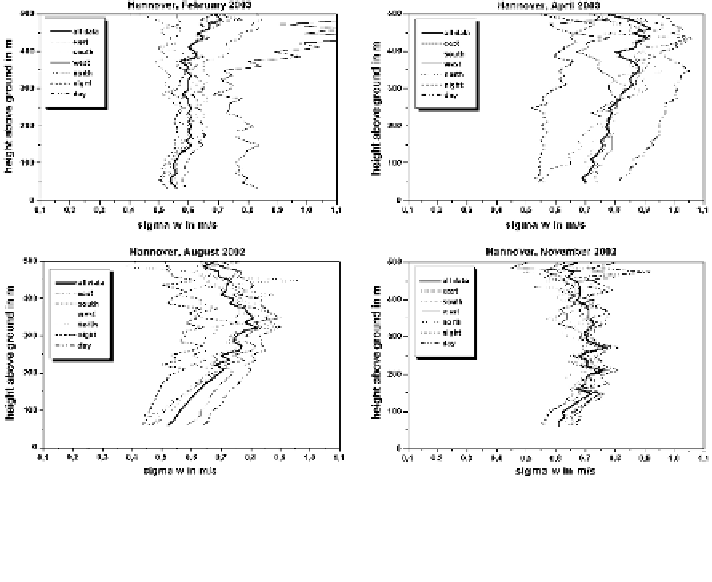
Fig. 3.26 Monthly mean profiles of the standard deviation of the vertical wind component over the
city of Hannover (Germany) from SODAR measurements (bold lines) for February 2003 (upper
left), April 2003 (upper right), August 2002 (lower left) and November 2002 (lower right). Full
lines show all data, dash-dotted lines show daytime data and dashed lines show night-time data
In autumn, winter, and generally at night-time, the profiles show a strong decrease
of the turbulence intensity with height within the lower 150-200 m.
Similar profiles as those depicted in Figs.
3.25
,
3.26
,
3.27
have been found over
other cities as well (e.g., Moscow in Russia and Linz in Austria, see Emeis et al.
2007b
for details). The diurnal course of the variance of the vertical velocity
component in summertime is found to be quite similar in Hannover and Moscow.
Nevertheless, Fig.
3.28
indicates that the overall level of the standard deviation is
somewhat larger over the much larger city of Moscow than over the smaller city of
Hannover although the mean wind speeds in Moscow in July 2005 were even
lower than in Hanover in August 2002. Both plots show that the standard deviation
increases with height at daytime and night-time in summer.
3.7.3 Special Flow Phenomena in Urban Canopy Layers
The flow in the urban canopy layer exhibits special features. Among these are the
channelling of flow in street canyons and between taller buildings (see
Sect. 4.1
),
the speed-up of flow over building tops like over hill tops (see
Sect. 4.2
), the
formation
of
lee-eddies
behind
buildings,
and
the
high
variability
of
wind
Search WWH ::

Custom Search