Geoscience Reference
In-Depth Information
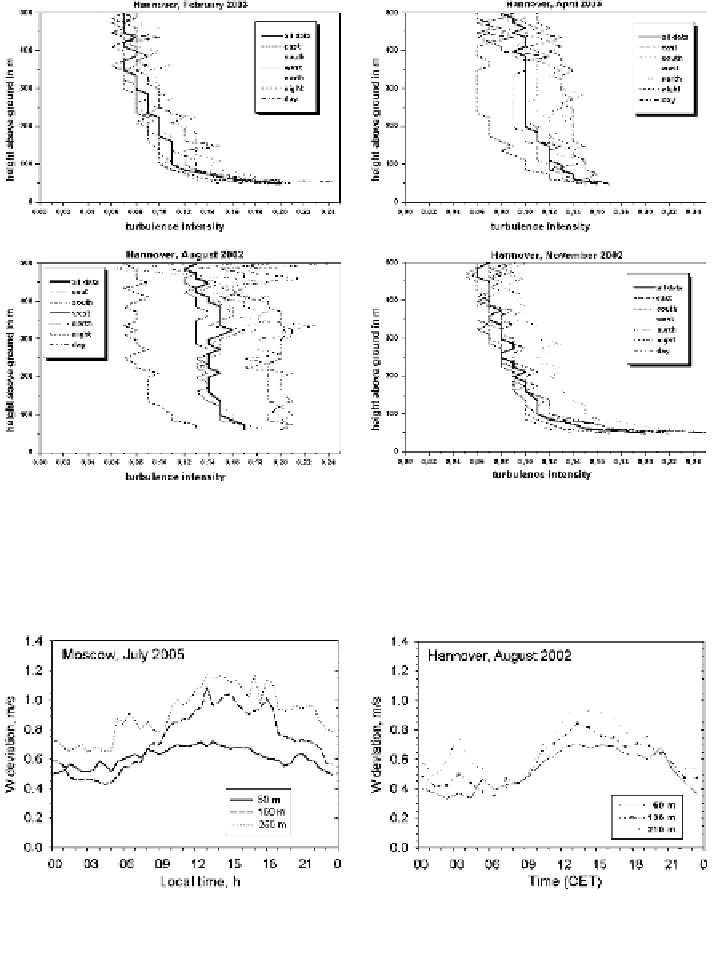
Fig. 3.27 Monthly mean profiles of turbulence intensity over the city of Hannover (Germany)
from SODAR measurements (bold lines) for February 2003 (upper left), April 2003 (upper right),
August 2002 (lower left) and November 2002 (lower right). Full lines show all data, dash-dotted
lines show daytime data and dashed lines show night-time data
Fig. 3.28 Monthly mean diurnal variation of the standard deviation of the vertical wind
component for three different heights for a summer month over Moscow, Russia (left) and
Hannover, Germany (right) plotted against local time
directions. The frequent wind direction changes in urban areas may favour the
deployment of smaller turbines with a vertical rotor axis which operate in winds
from any direction without adjustment. More details on winds in cities may be
found in Cermak et al. (
1995
).
Search WWH ::

Custom Search