Geoscience Reference
In-Depth Information
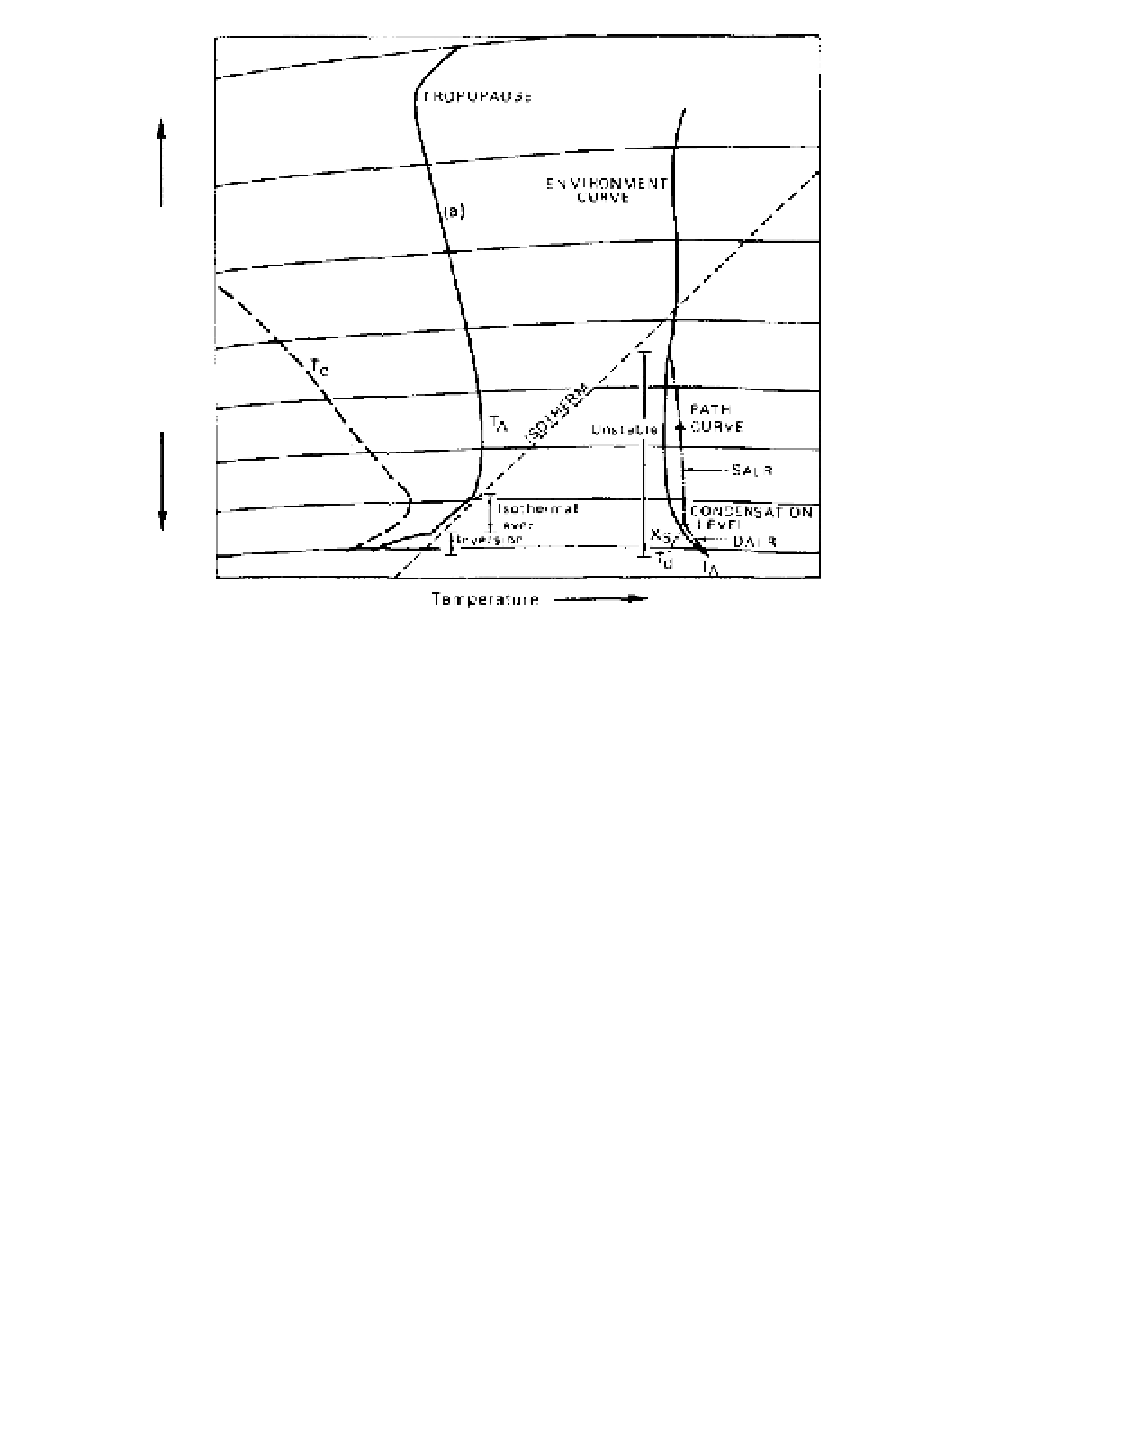
Figure 5.3
Tephigram showing (A)
stable air case -
T
A
is the air temper-
ature and
T
d
the dew-point; and (B)
unstable air case. The lifting conden-
sation level is shown, together with
the path curve (arrowed) of a rising air
parcel.
X
s
is the saturation humidity
mixing ratio line through the dew-
point temperature (see text).
A
Stable case
B
Unstable case
TROPOPAUSE
ENVIRONMENT
CURVE
A
B
Height
T
d
Pressure
PATH
CURVE
T
A
Unstable
SALR
Isothermal
layer
CONDENSATION
LEVEL
DALR
X
S
Inversion
T
d
T
A
Temperature
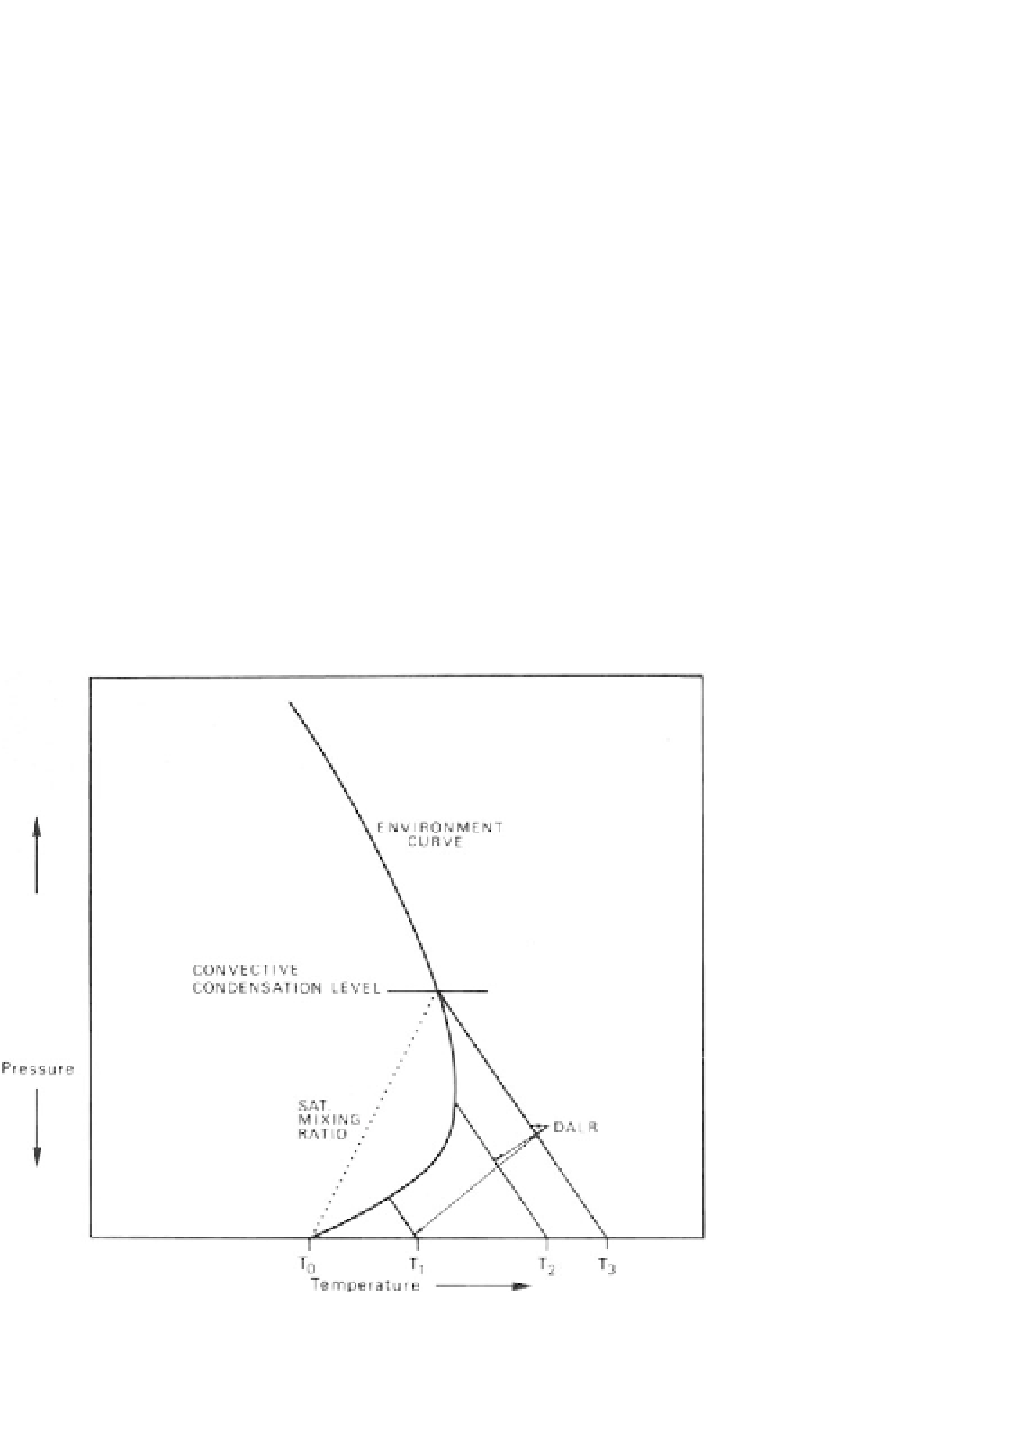
Figure 5.4
Schematic adiabatic chart
used to determine the convective
condensation level (see p. 91).
T
0
represents the early morning temper-
ature:
T
1
,
T
2
and
T
3
illustrate daytime
heating of the surface air.
ENVIRONMENT
CURVE
Height
CONVECTIVE
CONDENSATION LEVEL
Pressure
SAT.
MIXING
RATIO
DALR
T
0
T
1
T
2
T
3
Temperature