Geoscience Reference
In-Depth Information
are commonly plotted on an adiabatic chart. The dry
adiabats are also lines of constant potential temperature,
θ (or isentropes). Potential temperature is the temper-
ature of an air parcel brought dry adiabatically to a
pressure of 1000 mb. Mathematically,
as Normand's theorem, is used to estimate the
lifting
condensation level
(see Figure 5.3). For example, with
an air temperature of 20°C and a dew-point of 10°C at
1000 mb surface pressure (Figure 5.1), the lifting con-
densation level is at 860 mb with a temperature of 8°C.
The height of this 'characteristic point' is approximately
θ =
T
(
——
)
p
1000
0.286
h
(m) = 120(
T
-
T
d
)
where
T
= air temperature and
T
d
= dew-point tem-
perature at the surface in °C.
The lifting condensation level (LCL) formulation
does not take account of vertical mixing. A modified
calculation defines a
convective condensation level
(CCL). In the near-ground layer surface heating may
establish a superadiabatic lapse rate, but convection
modifies this to the DALR profile. Daytime heating
steadily raises the surface air temperature from
T
0
to
T
1
,
T
2
and
T
3
(Figure 5.4). Convection also equalizes the
humidity mixing ratio, assumed equal to the value for
the initial temperature. The CCL is located at the inter-
section of the environment temperature curve with a
saturation mixing ratio line corresponding to the average
mixing ratio in the surface layer (1000 to 1500 m).
Expressed in another way, the surface air temperature
is the minimum that will allow cloud to form as a result
of free convection. Because the air near the surface is
often well mixed, the CCL and LCL, in practice, are
commonly nearly identical.
Experimentation with a tephigram shows that both
the convective and the lifting condensation levels rise
as the surface temperature increases, with little change
of dew-point. This is commonly observed in the early
afternoon, when the base of cumulus clouds tends to be
at higher levels.
where
and
T
are in K, and
p
= pressure (mb).
The relationship between
T
and
θ
θ
; also between
T
and
θ
w
, the wet-bulb potential temperature (where the air
parcel is brought to a pressure of 1000 mb by a saturated
adiabatic process), is shown schematically in Figure 5.2.
Potential temperature provides an important yardstick
for airmass characteristics, since if the air is affected
only by dry adiabatic processes the potential temper-
ature remains constant. This helps to identify different
airmasses and indicates when latent heat has been
released through saturation of the airmass or when
non-adiabatic temperature changes have occurred.
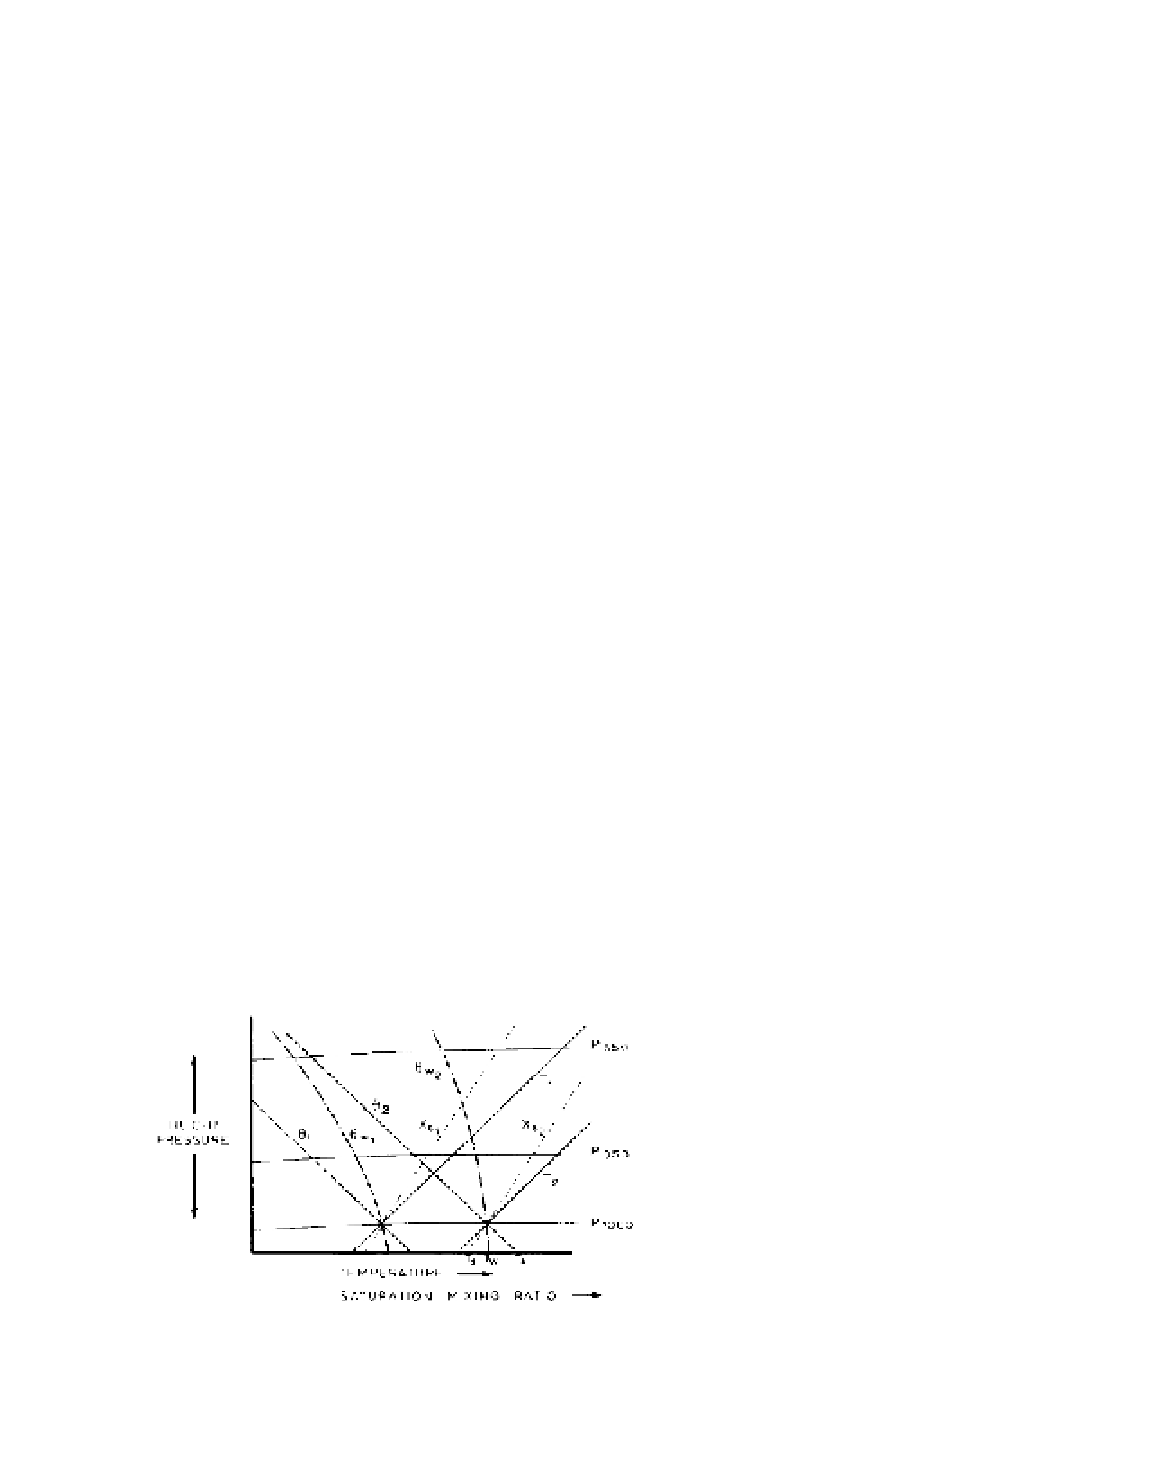
B CONDENSATION LEVEL
Figure 5.2 illustrates an important property of the
tephigram. A line along a dry adiabat (θ) through the
dry-bulb temperature of the surface air (
T
A
), an isopleth
of saturation mixing ratio (
x
s
) through the dew-point
(
T
d
), and a saturated adiabat (
θ
w
) through the wet-bulb
temperature (
T
w
), all intersect at a point corresponding
to saturation for the airmass. This relationship, known
C AIR STABILITY AND INSTABILITY
If stable (unstable) air is forced up or down it has a
tendency to return to (continue to move away from) its
former position once the motivating force ceases. Figure
5.3 shows the reason for this important characteristic.
The environment temperature curve (A) lies to the right
of any
path curve
representing the lapse rate of an
unsaturated air parcel cooling dry adiabatically when
forced to rise. At any level, the rising parcel is cooler and
more dense than its surroundings and therefore tends
to revert to its former level. Similarly, if air is forced
Figure 5.2
Graph showing the relationships between tempera-
ture (
T
), potential temperature (
θ
), wet-bulb potential temperature
(
θ
w
) and saturation mixing ratio (
X
s
).
T
d
= dew-point,
T
w
= wet-
bulb temperature and
T
A
= air temperature.