Geoscience Reference
In-Depth Information
315
400
0.3
310
350
305
300
0.2
300
250
295
NO
2
200
0.1
290
150
285
CFC-11
1967-1971
1989
2001
100
280
0.0
1750
1800
1850
1900
1950
2000
50
Thousands of years (BP)
July
Aug
Sept
Oct
Nov
Dec
Figure 2.8
Concentration of (A) nitrous oxide,
N
2
O (left scale), which has increased since the mid-
eighteenth century and especially since 1950; and
of (B) CFC-11 since 1950 (right scale). Both in parts
per billion by volume (ppbv).
Source: After IPCC (1990 and 2001).
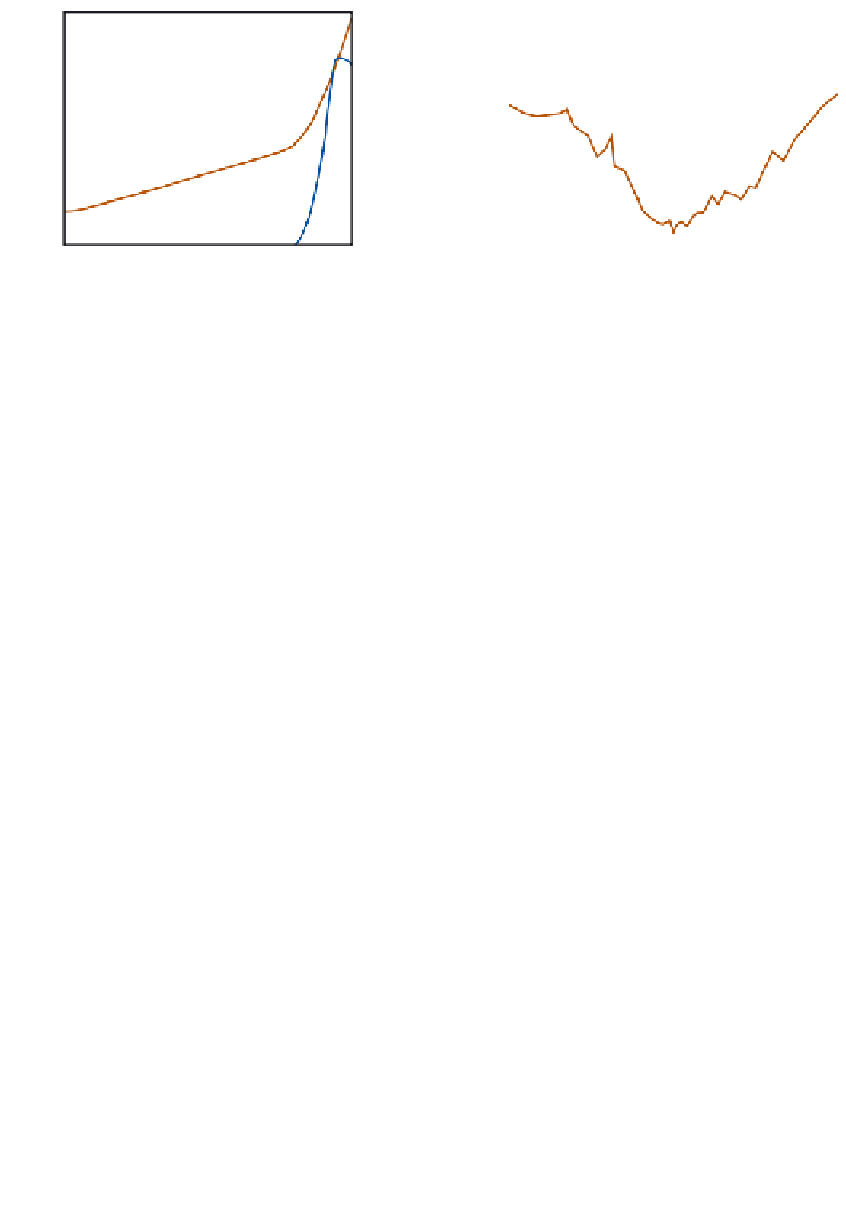
Figure 2.9
Total ozone measurements from
ozonesondes over South Pole for 1967-1971, 1989
and 2001, showing deepening of the Antarctic
ozone hole.
Source: Based on Climate Monitoring and Diagnostics
Laboratory, NOAA.
10
km
•
Ozone
(O
3
) is distributed very unevenly with
height and latitude (see
Figure 2.4
) as a result
of the complex photochemistry involved in its
production (A.2, this chapter). Since the late
1970s, dramatic declines in springtime total
ozone have been detected over high southern
latitudes. The normal increase in stratospheric
ozone associated with increasing solar radia-
tion in spring apparently failed to develop.
Observations in Antarctica show a decrease in
total ozone in September to October from
320DU (10
-3
cm at standard atmospheric
temperature and pressure) in the 1960s to
around 100 in the 1990s. Satellite measure-
ments of stratospheric ozone (
Figure 2.9
)
illustrate the presence of an 'ozone hole' over
the south polar region (see
Box 2.1
)
. Similar
reductions are also evident in the Arctic and at
lower latitudes. Between 1979 and 1986 there
was a 30 percent decrease in ozone at 30-40km
altitude between latitudes 20 and 50
MAM
SON
9
45
40
8
35
7
6
30
5
26
4
21
3
17
2
12
-10
-8
-6 -4 -2
% change per decade
0
2
4
6
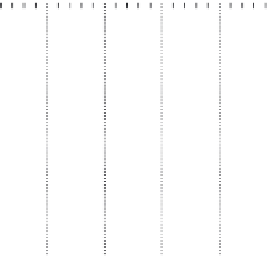
Figure 2.10
Changes in stratospheric ozone
content (percent per decade) during March to
May and September to November 1978-1997
over Europe (composite of Belsk, Poland, Arosa,
Switzerland and Observatoire de Haute Provence,
France) based on umkehr measurements.
Source: Adapted from Bojkov et al. (2002) Meteorology and
Atmospheric Physics, 79, p. 148, Fig. 14a.
N and S
(
Figure 2.10
); along with this there has been an
increase in ozone in the lowest 10km as a result
of anthropogenic activities. Tropospheric
ozone represents about 34DU compared
with 25 pre-industrially. These changes in the
vertical distribution of ozone concentration
°
are likely to lead to changes in atmospheric
heating (Chapter 2C), with implications for
future climate trends (see Chapter 11). The
global mean column total decreased from
306DU for 1964-1980 to 297 for 1984-1993
(see
Figure 2.4
). The decline over the past 25