Geoscience Reference
In-Depth Information
AD
2000
X
1750
1500
1250
1000
750
500
1000
500
300
200
100
Time (years BP)
50
25
10
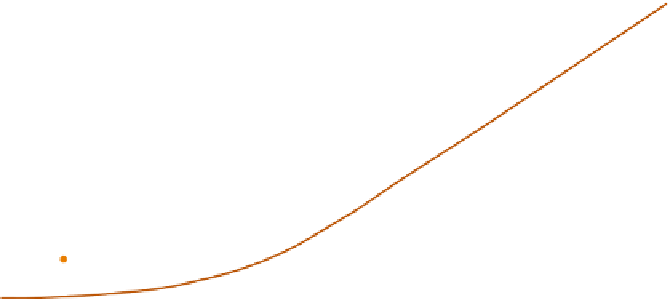
Figure 2.7
Methane concentration (parts per million by volume) in air bubbles trapped in ice dating back
to 1000 years
BP
obtained from ice cores in Greenland and Antarctica and the global average for
AD
2000
(X).
Source: Data from Rasmussen and Khalil, Craig and Chou, and Robbins; adapted from Bolin et al. (eds) The Greenhouse Effect,
Climatic Change, and Ecosystems(SCOPE 29). Copyright © 1986. Reprinted by permission of John Wiley & Sons, Inc.
Table 2.4
Mean annual release and
consumption of CH
4
(T
g
= 10
1
g
)
Mean
•
Chlorofluorocarbons
(CF
2
Cl
2
and CFCl
3
), better
known as 'freons' CFC-11 and CFC-12,
respectively, were first produced in the 1930s
and now have a total atmospheric burden of
10
10
kg. They increased at 4-5 percent per
year up to 1990, but CFC-11 has slowly
declined since the mid-1990s and CFC-12
is nearly static, after peaking in 2003, as a
result of the Montreal Protocol agreements to
curtail production and use substitutes (see
Figure 2.9B
). Although their concentration is
<1ppbv, CFCs account for nearly 10 percent
of the greenhouse effect. They have a residence
time of 55-130 years in the atmosphere.
However, while the replacement of CFCs
by hydrohalocarbons (HCFCs) can signifi-
cantly reduce the depletion of stratospheric
ozone, HCFCs still have a large greenhouse
potential.
Range
A Release
Natural wetlands
115
100-200
Rice paddies
110
25-170
Enteric fermentation
80
65-110
(mammals)
Gas drilling
45
25-50
Biomass burning
40
20-80
Termites
40
10-100
Landfills
40
20-70
Total
c. 530
B Consumption
Soils
30
15-30
Reaction with OH
500
400-600
Total
c. 530
Source: Tetlow-Smith (1995).