Geoscience Reference
In-Depth Information
improvements had been achieved through the
mandatory use of gasoline additives in winter,
restrictions on wood burning, and scrubbers
installed on power plants.
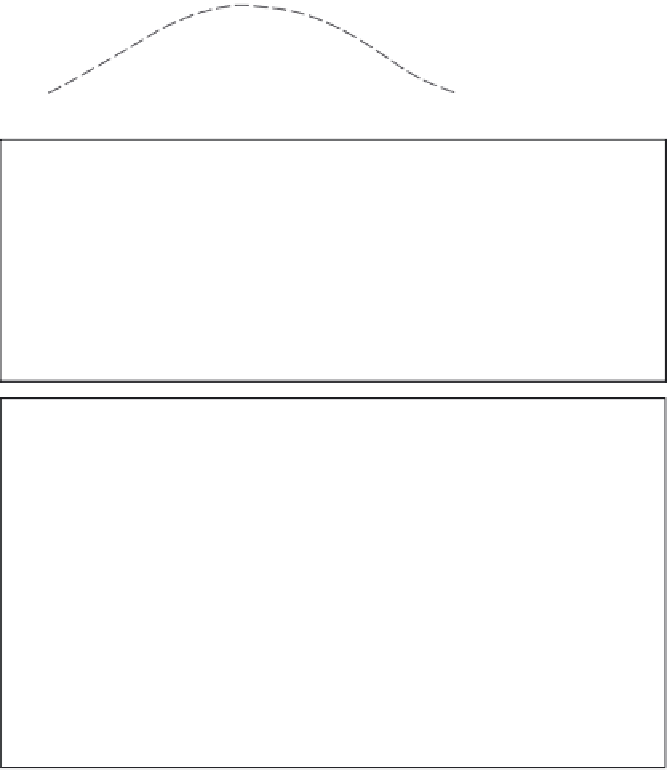
particularly the presence of temperature
inversions, and on wind speed. A pollution dome
develops as pollution accumulates under an
inversion that forms the urban boundary layer
(
Figure 12.23A
). A wind speed as low as 2m s
-1
is
sufficient to displace the Cincinnati pollution
dome downwind, and a wind speed of 3.5m s
-1
will disperse it into a plume.
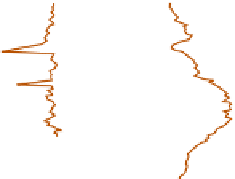
Figure 12.23B
shows
a section of an urban plume with the volume
Pollution distribution and impacts
Polluted atmospheres often display well-marked
physical features around urban areas that are
very dependent upon environmental lapse rates,
(A)
Inversion
Pollution dome
Cold
Cold
(B)
Wind
Pollution
plume
Urban
canopy
Fanning
Fumigation
Rural
boundary
layer
Lofting
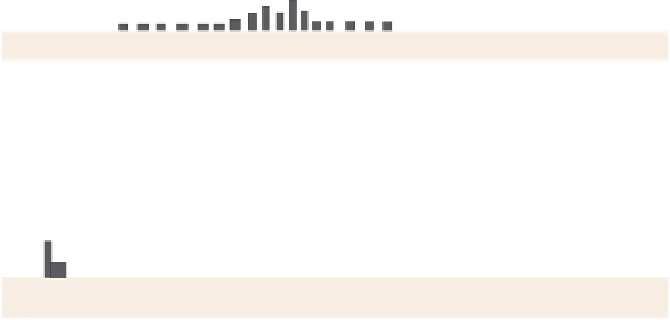
(C)
Power plant
Wind
Refinery
SPRINGFIELD
ozone (ppm)
DECATUR
ST. LOUIS
0
50
light scattering
km
Figure 12.23
Configurations of urban pollution. A: Urban pollution dome. B: Urban pollution plume in a
stable situation (i.e. early morning following a clear night). Fanning is indicative of vertical atmospheric
stability. C: Pollution plume northeast of St Louis, Missouri, on 18 July 1975.
Sources: B: After Oke (1978); C: after White et al. (1976) and Oke (1978). By permission of Routledge and Methuen.