Geoscience Reference
In-Depth Information
(A)
January
(A)
January
90°E
90°E
H
H
L
H
180°
0°
180°
L
0°
1020
L
L
H
H
H
1020
102
0
90°W
90°W
(B)
July
(B)
July
90°E
90°E
H
L
L
H
L
L
180°
0°
180°
0°
L
L
H
L
H
H
1020
H
1025
1020
90°W
90°W
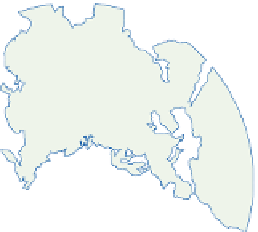
Figure 7.9
The mean sea-level pressure distribu-
tion (mb) in January and July for the Northern
Hemisphere, 1970-1999.
Source: NCEP/NCAR Reanalysis Data from the NOAA-CIRES
Climate Diagnostics Center.
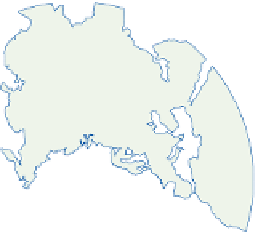
Figure 7.10
The mean sea-level pressure dis-
tribution (mb) in January and July for the Southern
Hemisphere, 1970-1999. Isobars not plotted over
the Antarctic ice sheet.
Source: NCEP/NCAR Reanalysis Data from the NOAA-CIRES
Climate Diagnostics Center.
it, especially towards the heated continental
interiors of the summer hemisphere. Poleward of
the subtropical anticyclones lies a general zone
of subpolar low pressure. In the Southern
Hemisphere, this sub-Antarctic Trough is virtu-
ally circumpolar (see
Figure 7.10
), whereas in the
Northern Hemisphere the major centers are near
Iceland and the Aleutians in winter and primarily
over continental areas in summer. In winter, the
Arctic region is affected by high and low pressure
cells with semi-permanent cold air anticyclones
over Siberia and, to a lesser extent, northwestern
Canada. While it is still sometimes stated that
anticyclonic conditions dominate the Arctic
region, this is clearly not the case. The shallow
Siberian high is in part a result of the exclusion
of tropical air masses from the interior by the