Geoscience Reference
In-Depth Information
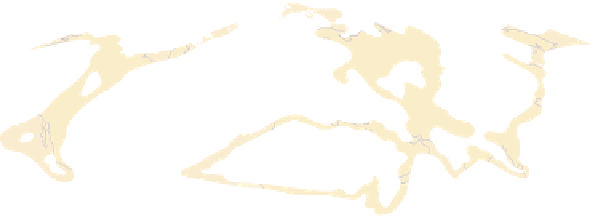
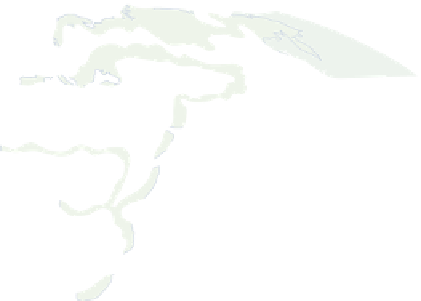
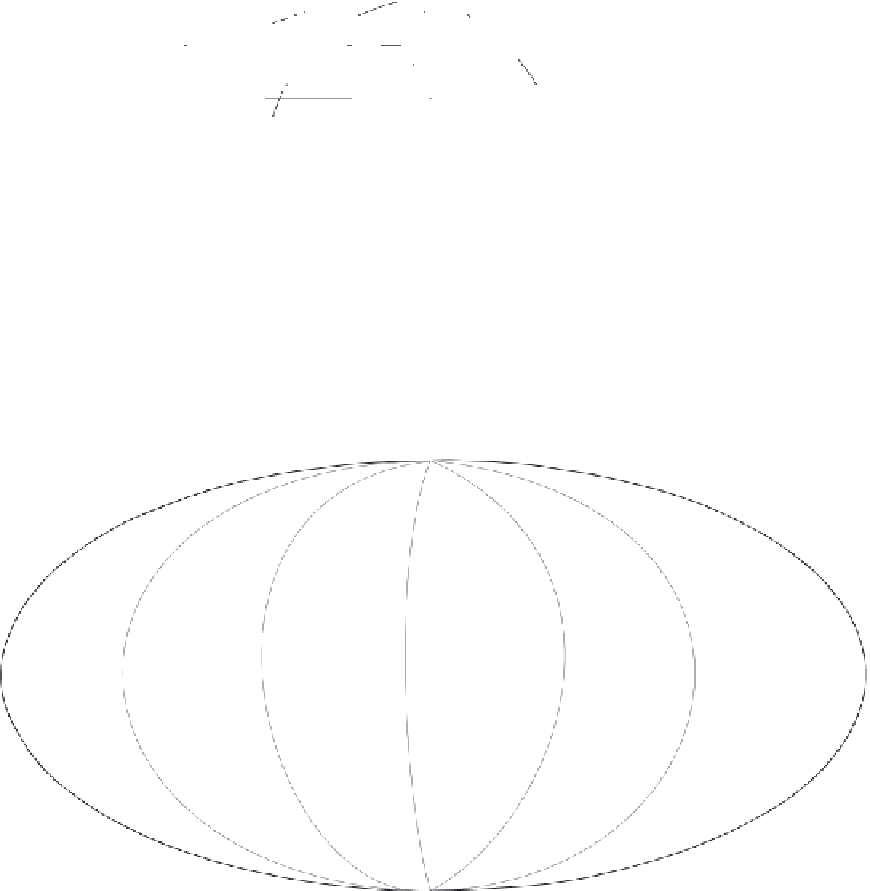
December-February
60°N
40°N
20°N
0°
20°S
40°S
60°S
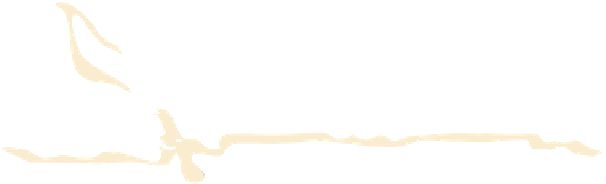
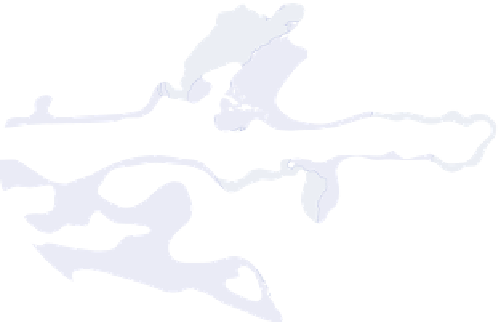
June-August
60°N
40°N
20°N
0°
20°S
40°S
60°S
0.5
1.0
2.0
mm per day
2.0
4.0
6.0
6.0
10.0
10.0
mm per day
Figure 4.16
Mean global precipitation (mm per day) for the periods December to February and June to August.
Source: From Legates (1995). From International Journal of Climatology, copyright © John Wiley & Sons Ltd. Reproduced with permission.
increase may be observed up to at least 3000-
4000m in the Rocky Mountains in Colorado. In
western North America the maximum occurs on
the windward slopes of the Sierra Nevada, while
in western Canada there is a close association of
terrain and precipitation maxima. In the Alps
patterns vary with maxima at high elevations in
the central Alps and at low elevations on the outer