Geoscience Reference
In-Depth Information
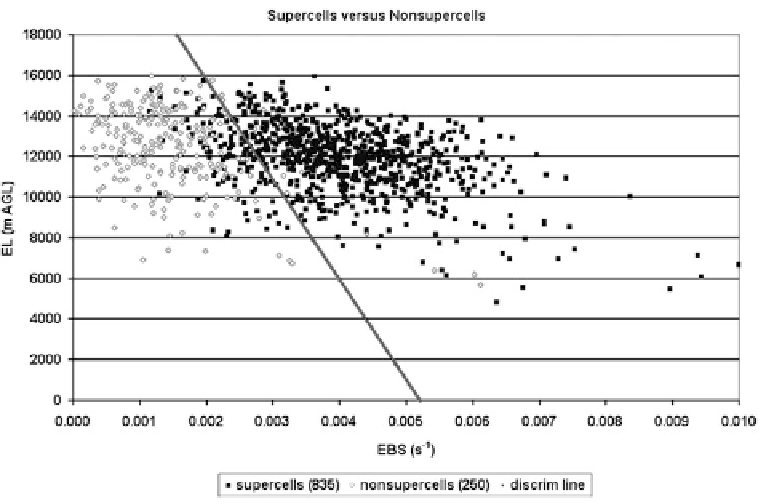
Figure 7.2. Scatterplot of equilibrium level (EL) height vs. EBS (''effective bulk shear,'' which
is the effective bulk wind difference in the lower half of the storm, similar to bulk shear in the
lowest 6 km; ''bulk'' refers to an incremental measure that accounts for the length and
curvature of the hodograph) for supercells (solid black squares) and non-supercells (open gray
squares). A linear discriminant function is plotted (solid gray line) that separates the supercells
(right of the line) from the non-supercells (left of the line) in 89% of all cases. A crude measure
of the discriminant would be for an average EL of approximately 12 km, the EBS separating
supercells from non-supercells is approximately 0.003 s
1
6km
¼
18m s
1
(from Thompson
et al., 2007).
Chapters 3-6, which detail the physics of these phenomena, to find out what the
ingredients for them are or might be.
Forecasting on time scales of days in advance is made possible by numerical
models that do not explicitly represent cumulus convection, but do represent the
broad synoptic-scale and some mesoscale features that produce the ingredients
needed for severe convection. The presence or absence of the ingredients are
assessed through diagnostics such as the water vapor mixing ratio (e.g., in a well-
mixed boundary layer), the vertical profile of temperature and dewpoint, the
vertical profile of winds, and vertical velocity either represented explicitly in prim-
itive equation models or computed from a quasi-geostrophic
equation applied to
the filtered geopotential height field or from objectively analyzed actual radiosonde
data.
In addition to evaluating the parameters necessary to determine whether the
necessary ''ingredients'' are available, pattern recognition (an example of which
was given at the beginning of this section) and climatology are also used by fore-
!
Search WWH ::

Custom Search