Geoscience Reference
In-Depth Information
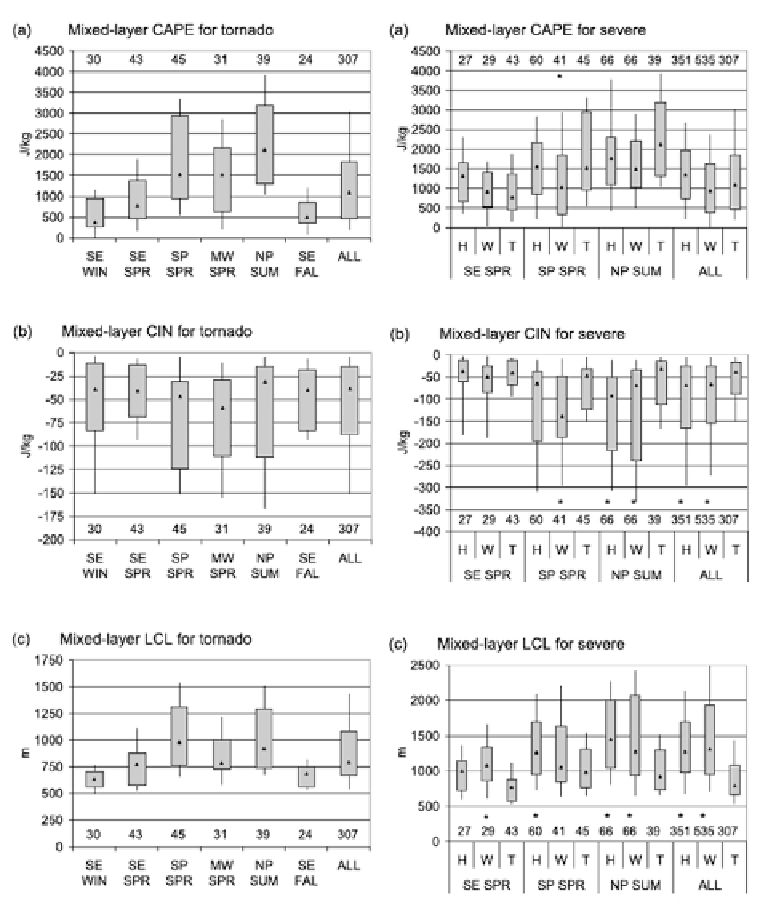
Figure 7.1. Box-and-whiskers plots of (a, left) mixed-layer CAPE for all tornadoes, regardless
of whether they were in supercells or ordinary cells or MCSs, (a, right) mixed-layer CAPE for
all severe events. (H), (W), and (T) refer to hail, wind, and tornado events, respectively. (b, left)
mixed-layer CIN for all tornadoes, (b, right) mixed-layer CIN for all severe events, (c, left)
mixed-layer LCL for all tornadoes, and (c, right) mixed-layer LCL for all severe events, in the
southeast (SE), Midwest (MW), southern plains (SP), and northern plains (NP) of the U. S.
during the spring (SPR), summer (SUM), and fall (FAL) and for the entire sample (ALL), for
the contiguous U. S. from 2000 to 2008. The shaded box covers the 25th-75th percentiles, the
whiskers extend to the 10th and 90th percentiles, and the median values are marked by a
triangle within each shaded box. The number of events is provided for each category along the
abscissa (from Grams et al., 2012).
Search WWH ::

Custom Search