Geoscience Reference
In-Depth Information
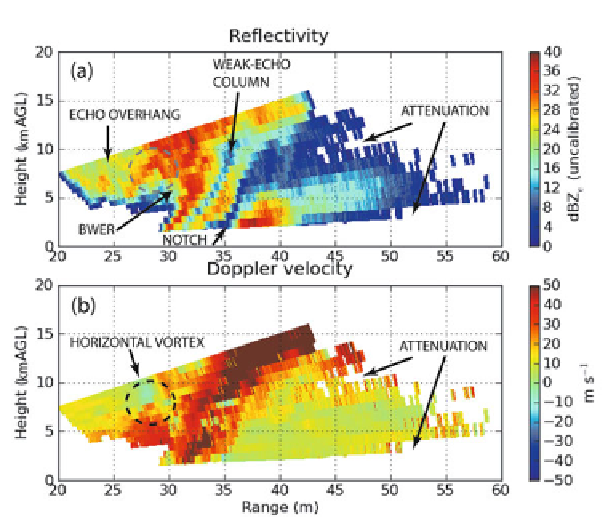
Figure 6.51a. Weak-echo column (WEC) in a tornadic supercell on May 4, 2007 near
Greensburg, KS, as detected by the U. Mass. X-Pol, mobile Doppler radar. The WEC extends
from low altitude up to at least 12 km ARL. Vertical cross sections through the center of
tornado of radar reflectivity factor in dBZ
e
(top) and Doppler velocity (bottom). In the top
panel, a weak echo column is also seen, but it represents a slice through a notch of precipitation
free air that has been advected around the mesocyclone and tornado. A horizontal vortex
signature is seen in the echo overhang region, above the bounded weak-echo region (BWER)
(courtesy of R. Tanamachi, from Tanamachi et al., 2012).
to r
¼
0, we find that
2
max
D
p
0
!
r
c
¼v
=
2
0
ð
6
:
49
Þ
where the pressure drop
p is given here with respect to the pressure at the radius
of maximum wind, the core radius. Now, substituting (6.48) into (6.46) and
integrating from r
¼1
to r
¼
r
c
, we find that
D
D
2
max
p
r
c
!1
¼v
=
0
ð
6
:
50
Þ
2
So, the total pressure drop from the environment of the vortex to its center
2
max
D
p
1!
0
¼ v
=
0
ð
6
:
51
Þ
v
max
100m s
1
0
1m
3
kg
1
,
For
and
it
follows
from (6.51)
that
D
p
1!
0
100 hPa. Tim Samaras and his Storm Intercept Group have made
measurements using portable instrument packages of pressure drops in tornadoes
at the ground of as much as 100 hPa, which is in at least qualitative agreement
with theory. Formula (6.51), however, neglects turbulent mixing, asymmetries, and
Search WWH ::

Custom Search