Geoscience Reference
In-Depth Information
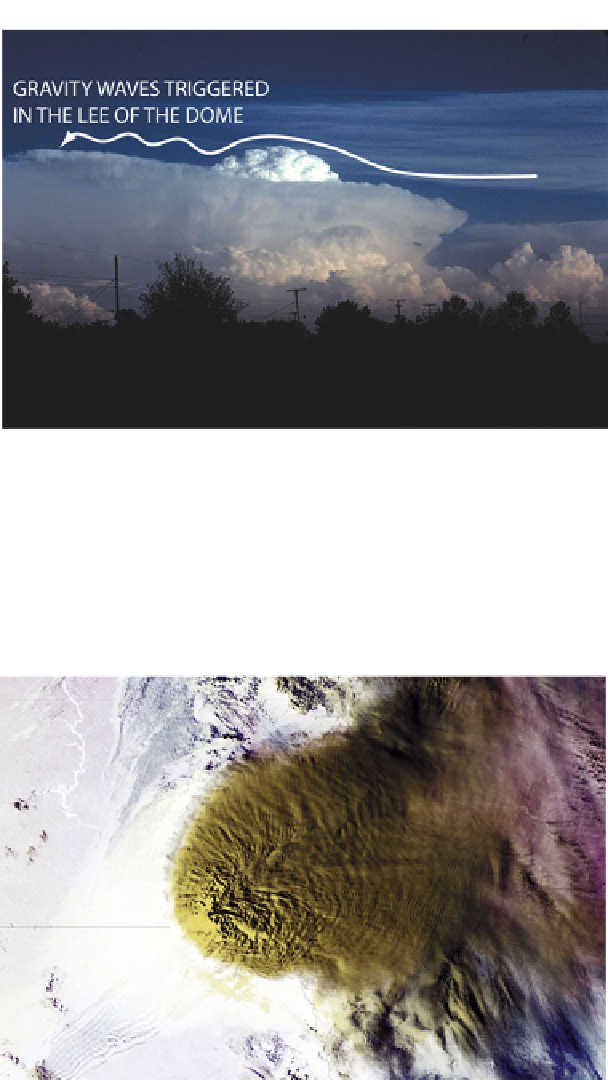
Figure 3.8. Schematic of airflow over a dome at the top of a convective storm in eastern
Oklahoma on May 1, 1980. Streamline shown is indicated for flow near the top of the storm
when the storm is propagating more slowly than the wind speed. Air is lifted over the dome and
then undergoes stable vertical oscillations downstream from the dome (photograph by the
author).
Figure 3.9. Waves in the anvil of a convective storm (caused by gravity waves) on July 9,
2009, over the upper Midwest of the U. S., as seen by the NOAA 15 satellite (from Martin
Setvak).
Search WWH ::

Custom Search