Geoscience Reference
In-Depth Information
(a)
(b)
(c)
Isobar
Cool polar air
Occlusion
L
L
Warm tropical
air
Cloud
America and a trough near the eastern coast of the United
States. This means that depression formation is most
likely in the area off the east coast of the United States
(
Figure 6.14
).
The depressions intensify, reach their
maximum intensity near Iceland, then decay. The average
position of the depressions shown on mean pressure
charts is near Iceland for this reason. It represents the most
frequent track of the depressions and where, on average,
they reach their lowest pressure. Because the lows are
areas of rising air, they are almost always accompanied by
extensive cloud and precipitation. The steep pressure
gradients and rapid falls of pressure which can occur
cause problems for the affected areas in terms of gales and
heavy rain.
Figure 7.7
shows the typical vertical cloud distribu-
tion and temperatures associated with a depression in
mid-latitudes. The details of cloud location and thickness
will depend upon the nature of the upper atmospheric
divergence and the temperatures and humidities, on
the time of year and on the sources of the air. If we could
look at the surface pattern of precipitation from the
depression, we would see how the areas of highest rainfall
tend to be just on the northern side of the depres-
sion track, with amounts decreasing northwards and
southwards. The width affected may stretch for about
1,200 km but will vary between depressions. The actual
track of the depression is determined by air flow in the
upper atmosphere and the temperature gradient at the
ground.
small wave develops along the front or baroclinic zone,
separating polar and tropical air masses (
Figure 7.5a
)
. In
some cases no further development takes place and the
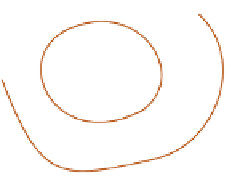
wave gradually dies out. More often the wave begins to
amplify and a small low-pressure centre forms. Gradually
air pressure within this centre falls, the winds strengthen
and the area of low pressure expands (
Figure 7.5b
)
.
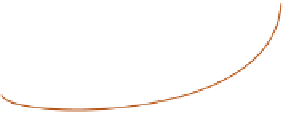
Eventually the system starts to fill and the depression
gradually disappears
(
Figure 7.5c
).
What we see at the surface is only part of the story,
however, for the depression also extends up into the
atmosphere. The low-pressure centre represents a complex
column of rising air - one which is often visible on satellite
understand the depression more fully, we need to ascend
to the top of the column, to the upper atmosphere, where
we find the waves in the upper westerlies. The flow around
the ridges and troughs is not always in equilibrium with
the pressure gradients. Where air moves out of a trough
it accelerates; as it approaches a trough it slows down
(
Figure 7.6
).
The air moving away from the trough draws
air from the lower atmosphere, causing a reduction in
surface pressure. Thus air is seen to converge at the ground
within the depression, rise upwards into the upper
atmosphere, and there diverge as it flows away from the
trough. The relative rates of surface convergence and of
upper-air divergence control the development of the
surface low. Whilst divergence exceeds convergence the
depression intensifies as air is drawn out of the system. At
that stage we find air pressure at the ground falling. If
convergence exceeds divergence the depression fills and air
pressure at the surface rises. This is what happens in the
final stages of the depression.
In the northern hemisphere the troughs and ridges of
the upper westerlies tend to favour certain locations. There
is normally a ridge near the western cordillera of North
Fronts
In many depressions we would find that there is not a
gradual change of temperature as the systems pass but
several sudden changes.
Figure 7.8
shows the trace from
a thermograph during the passage of a cyclone. If it has