Geoscience Reference
In-Depth Information
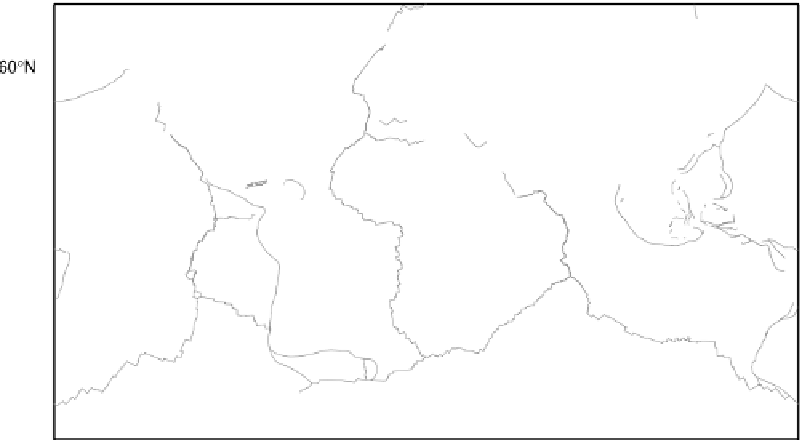
Figure 2.21.
A generalised world stress map. Lines show the orientation
of the maximum horizontal stress. A colour version of the map showing the
tectonic regimes - normal faulting, strike-slip faulting and thrust faulting - is
available on-line. (From Reinecker
et al.
2003, available on-line at
http://www.world-stress.org.)
plate motions. This is because hotspot tracks have average widths in excess of
100 km, which is orders of magnitude greater than the width of active trans-
form faults (
2 km) and the width of the transition between magnetic anomalies
(1-5 km). Continental plates tend to move more slowly than oceanic plates.
Similarly, plates with more than a quarter of their perimeter subducting tend
to move faster than plates that are hardly subducting anywhere. Values for the
absolute motions obtained by different authors vary somewhat depending upon
assumptions made and the particular relative plate motions used. Sources of
uncertainty in determining absolute motions are the determination of the motions
of the hotspot traces and assumptions about mantle dynamics and forces driving
the plates. Nevertheless, a framework of motion can be developed even if some
uncertainties remain. The Pacific and Indian plates are moving fast and the North
American plate more slowly, while the Eurasian and African plates are hardly
moving at all.
Figure 2.21 is a plot of the orientation of horizontal stress measured in the
interior of the plates. The pattern of these intraplate stresses in the crust (stress
is force per unit area) can be used to assess the forces acting on the plates. The
direction of the stresses is correlated with the direction of the absolute plate
motions (Fig. 2.20). This implies that the forces moving the plates around, which
act along the edges of the plates (Section 7.10) are, to first order, responsible for
the stresses in the lithosphere.
<