Geoscience Reference
In-Depth Information
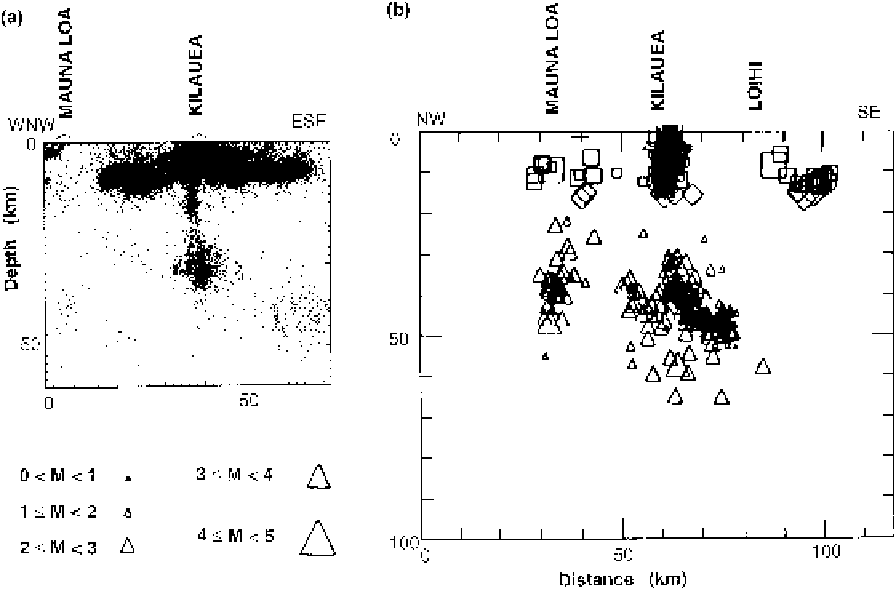
Figure 9.65.
The distribution of earthquakes recorded by the Hawaiian Volcano
Observatory along two cross sections through the island of Hawaii, approximately
perpendicular to those shown in Fig. 9.64. (a) All earthquakes, 1970-1983.
True scale. (b) Long-period earthquakes, 1972-1984. The magnitudes of the events
are indicated by the size of the symbol: events shallower than ,13km;
♦
, 13-20 km;
and
,20km. True scale. (From Klein
et al
.(1987) and Koyanagi
et al
.(1987).)
60 km depth. From there it rises through the plumbing system to the active vents.
Figure 9.66 shows a detailed view of the magma conduit beneath Kilauea. This
model was defined by well-located, magma-related earthquake foci; such defini-
tion is possible because fractures in the rocks around the magma chambers and
conduits open as the pressure of the magma increases. Thus, the maximum lat-
eral extent of the conduit at any depth corresponds to the region of hydraulically
induced seismicity at that depth. The conduit system enables the primary conduit
to supply magma to any of the structure vents or fissures. There are magma-supply
pathways from the summit magma reservoir beneath Kiluaea caldera both to the
eastern and to the southwestern rift zone.
Oceanic islands are inherently prone to failure. They are great upward-built
piles of rubble, set on oceanic sediments and down-warped crust. During the
building of an island, some detachment may occur at the contact between the