Geoscience Reference
In-Depth Information
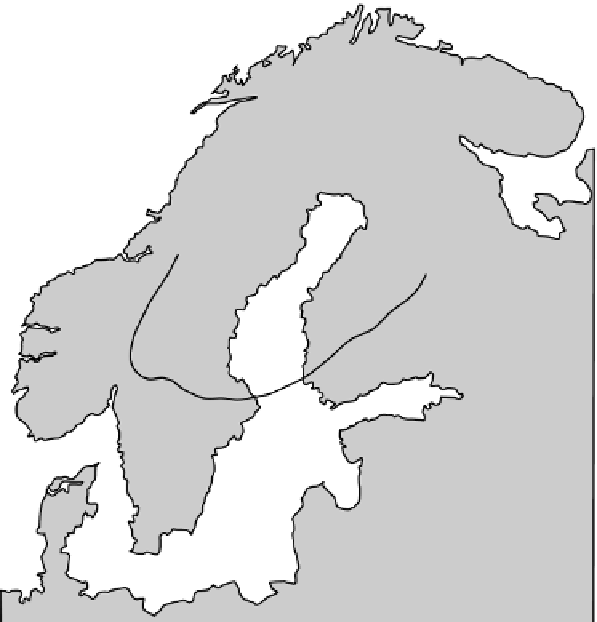
Figure 5.19.
The
present-day rate of
uplift occurring in
Fennoscandia. Contours
are in millimetres per
year. (After Ekman and
Makinen (1996).)
66
o
9
8
7
60
o
6
5
4
3
2
1
-1
0
14
o
28
o
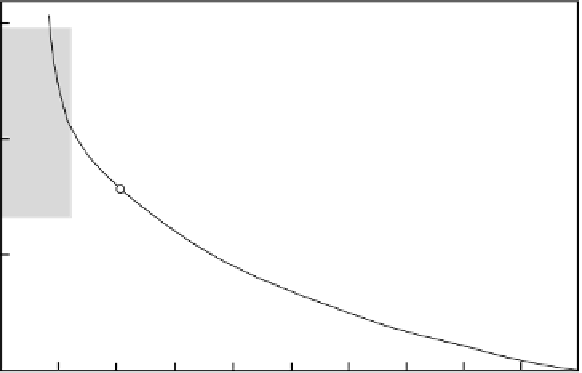
Figure 5.20.
Uplift in
central Fennoscandia
calculated for a constant-
viscosity (10
21
Pa s)
mantle (dashed line) and
geological observations
(o) from the northern Gulf
of Bothnia. The shading
indicates the time of
melting of the ice sheet.
(After Cathles (1975).)
300
Uplift in central
Fennoscandia
(mouth of Angerman River)
200
Model
100
0
10
8
6
4
2
0
Thousands of years before present