Geoscience Reference
In-Depth Information
200
180
160
140
120
100
80
60
40
20
0
0
N=29
Hermod
Hermod Mbr type well
25/2-6 (Mound)
I
I
ʹ
0
15 km
160
140
120
100
80
Shale (m)
60
40
20
25/5-1
(Depression)
I
I
′
25/1-7
25/2-1
25/2-10S
25/2-15
25/2-6
25/6-3
26/4-2
2000
1900
2400
2100
2100
2100
2000
2100
2500
2000
2200
2200
2200
2100
2200
2600
2100
2300
2300
2300
2200
2300
2700
2200
2400
2400
Core
2400
2300
Gamma-ray log
(scale not shown)
Sonic log
(scale not shown)
2800
2400
2500
2500
0
15
km
2400
2500
2900
Fig. 15.
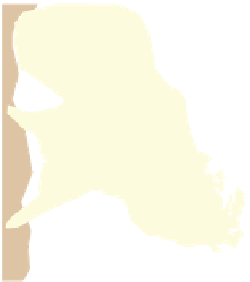
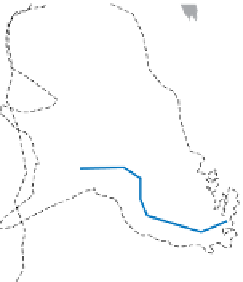
above: map distribution of the Hermod Member (Fig. 1) with wells colour coded according to where they plot in
the thickness parameter plots to the right. The plot demonstrates the lack of a statistically significant relationship between
shale thickness (i.e. claystone, siltstone and minor amounts of tuffs and limestone) and sandstone thickness. The wells
plotted in blue tend to be positioned in the more proximal or axial parts of the Hermod Fan and contain a thick Sele
Formation interval with low net-to-gross sandstone content compared to the wells plotted in red, which are all positioned
in the more distal part of the Hermod Fan. The inferred sand evacuation from well 25/5-1 and injection to well 25/2-6 (see
Fig. 13) are clearly anomalous compared to the other wells on the mapped Hermod Fan. Below: selected wells from a proxi-
mal to distal position relative to sediment sourced from the West Shetland Platform area. Main sandstone pulses indicated
by the petrophysical logs in the Våle Formation (Ty Member Sandstone), Sele Formation (Sele Member Sandstone), Balder
Formation (Odin Member Sandstone) and Horda Formation (Frigg Member Sandstone). The petrophysical logs do not
distinguish stratified sandstone-shale successions from sandstones with large shale clasts and the serrated log responses
seen in some wells may be caused by normal graded sandstones with mud cappings (as observed in core from well 25/1-7)
or shale-clast conglomerates (as observed in core from well 25/6-3).
and the large cumulative size of smaller circular
depressions (Fig. 12) further suggests that lateral
movement of sand was a very important contribu-
tor to the growth of the mounds. The possible lat-
eral transportation of sand from depressions to
mounds has also been suggested for the Cecilie
Field, denmark, where cores and diagnostic zir-
con layers have been used to support this interpre-
tation (Hamberg
et al
., 2007).
The injectites in the Balder Formation are
thought to have emanated from the mound shoul-
der, across faults that juxtaposed the mounded
sand to the Balder tuff section. This interpretation
is based on the observed common origin of flat,
inclined or complex reflectors from a break on the
Near Top Sele Formation at mound shoulders.
Injection into the Balder Formation from Intra
Sele Formation mounds is also described and rec-
ognised from the Balder-Ringhorne area, some
50 km south of Frøy (Wild & Breidis, 2010).
The timing of mound growth is restricted to a
window defined by the deposition of Hermod
sand (as this is believed to be a parent bed) and
the upward termination of faults on the steep side
of mounds (as these have contributed to the
mound shape). It is unknown if the faults were


Search WWH ::

Custom Search