Geoscience Reference
In-Depth Information
NO-1/3-3
45 6
NO-2/1- 6
45 6
NO-2/1-4
NO-2/1-3
45 6
NO-2/1-8
45 6
12 3
1
23
1
23
45 6
1
23
1
23
BCU
J74 MFS
Tambar
200m
1/3-3
J71 TEMFS
2/1-6
Gyda
2/1-3
Erosion
2/1-4
J66 MFS
2/1-8
J64 MFS
J63 TEMFS
J62 MFS
Top Bryne Fm
1
: TVDSS.
2
: MD.
3
: 0 GR 150.
4
: 1.95 RHOB 2.95 and 0.45 NPHI 0.15.
5
: 0.2 Res 200.
6
: 140 DT 40.
N
S
Lower shoreface sst
Offshore shale
Turbidite sandstone
Spiculitic shoreface sst (retrogradational)
Non-spiculitic shoreface sst (progradational)
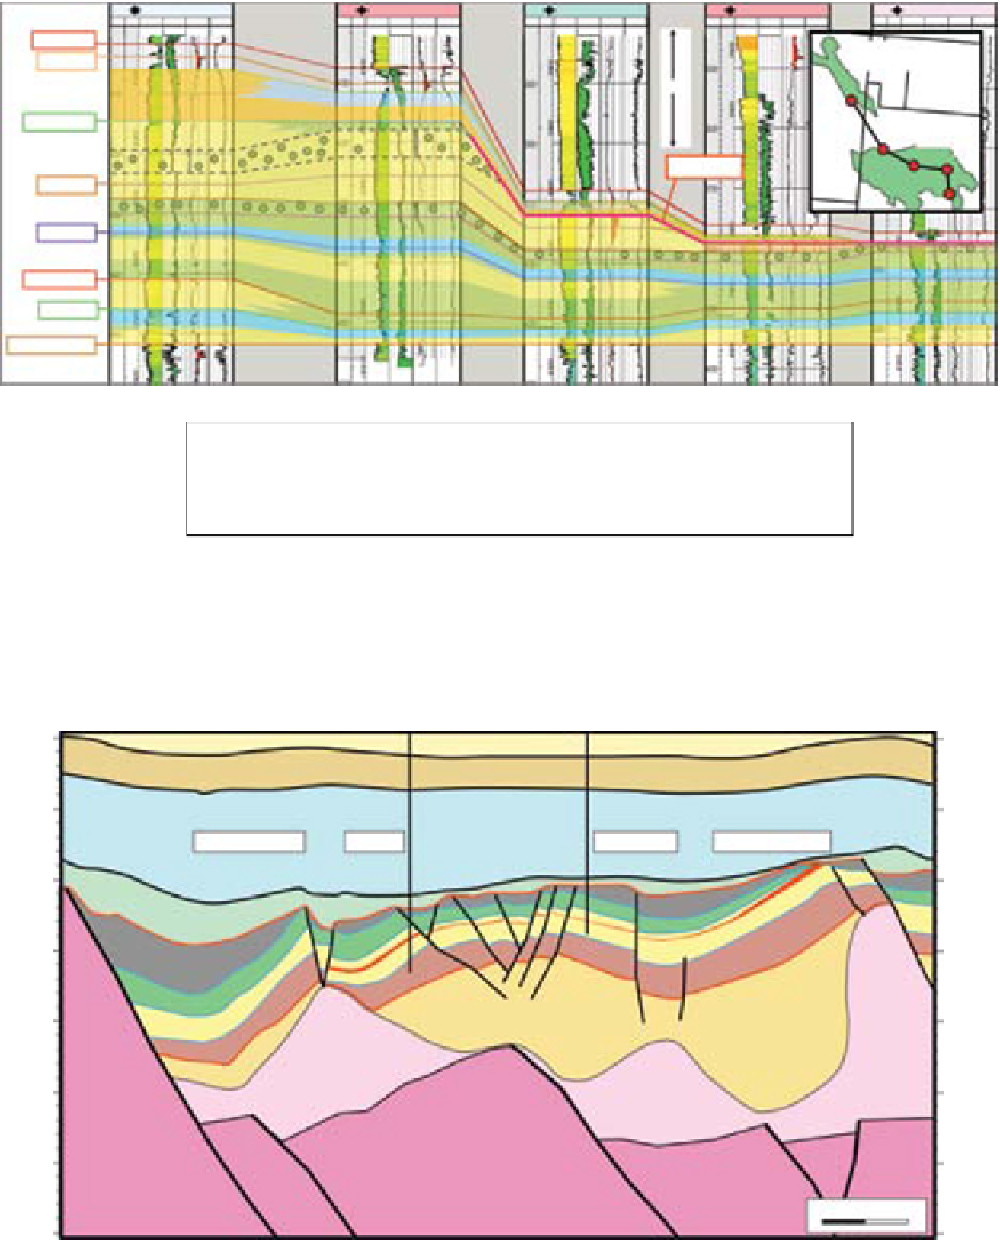
Fig. 14.
N-S aligned correlation panel from Tambar Field (left well) to Gyda Field (4 wells to right) showing truncation of
the Upper Jurassic sandstone in a crestal location (strong red line), removing spiculite sandstone (yellow with green spots)
and linked to downdip stratigraphic expansion dated to the J71 Fittoni TEMFS. Spiculite sandstone definition follows that
given by the study of Aase
et al
. (1996). TVDSS: True Vertical Depth Sub Sea (m); MD: Measured Depth (m); GR: Gamma
Ray log; DT: Delta Time (Sonic) log; RHOB: Bulk Density; NPHI: Neutron Porosity; Res: Resistivity.
SW
NE
29/4d-4
22/30c-13
3000
3000
3500
3500
Glenelg
Shearwater Field
West Franklin
Elgin Field
4000
4000
4500
4500
metres
Salt
metres
5000
Triassic
5000
Salt
Salt
5500
5500
Rotliegendes
6000
6000
2000 m
6500
6500
Fig. 15.
Geoseismic section showing the structural development of the West Franklin, Glenelg, Elgin and Shearwater fields.
A red unit towards the top of the Franklin Sandstone schematically indicates a thickening of the Top B Sands turbidite facies
interval towards Shearwater and Glenelg, away from the crest of Elgin Field which is supported on an underlying Rotliegend
fault block crest (figure adapted from Suiter
et al
., 2005). The location of this section is indicated on Figs 1 and 8.


Search WWH ::

Custom Search