Geoscience Reference
In-Depth Information
BVW
1
PHIE
PHIE
1
00
00
VWCL
VCOAL
Meters
MD
GR_PGL
NPHI_PG
L
BVW
TVDSS
0
150
-5250
Heather Fm.
5300
Franklin C
Sand
-5300
5350
-5350
5400
Franklin B
Sand
-5400
5450
-5450
5500
Franklin A
Sand
-5500
5550
-5550
5600
-5600
-5650
Pentland Fm.
-5650
5700
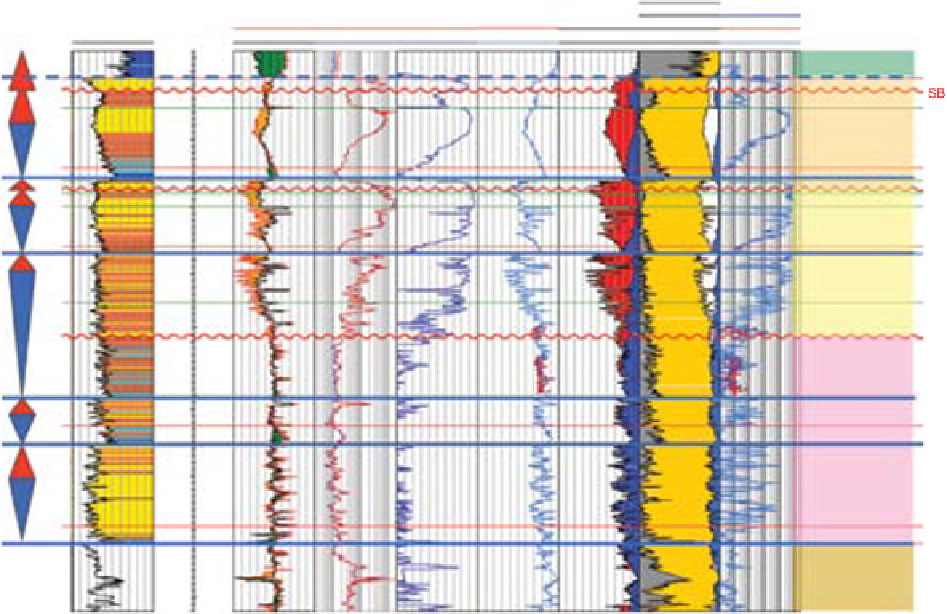
Fig. 16.
Progradational (blue triangle) and retrogradational (red triangle) stacking pattern development in the Franklin
Sandstone (Elgin Field well 22/30c-8). GR_PGL: Normalised Gamma Ray; MD: Measured Depth (m); TVDSS: True Vertical
Depth Sub Sea (m); RHOB_PGL: Bulk Density; NPHI_PGL: Neutron Porosity; ILM/ILD: Induction Log Medium/Deep;
CORESW: Water Saturation Core; SW: Water Saturation Log; COREPHIC: Corrected Total Porosity Core; PHIE: Effective
Porosity Log; PHIB: Density Porosity; BVW: Bulk Volume Water; VWCL: Volume Wet Clay; VCOAL: Volume Coal; COREKV:
Vertical Permeability Core; COREKH: Horizontal Permeability Core; PERM_PGL: Calculated Permeability.
et al
., 1999). However, due to the lack of grain size
differentiation and the low shale content, cycle
correlation is uncertain, particularly where wells
are spaced more than 500m apart. The work of
Lasocki
et al
. (1999) was superseded by that of
Wonham
et al
., (2002) following the integration
of numerous studies of core data across the field
(~1300m) and an improved intra-reservoir corre-
lation was achieved using a combined analysis
of wireline logs, core sedimentology (especially
trace fossil analysis), core chemostratigraphy,
spectral gamma ray logs and point-counted petro-
graphic data. These studies highlighted an impor-
tant intra-reservoir erosive event (Fig. 17; Wonham
et al
., 2002).
The erosion surface is observed in core in sev-
eral wells (Elgin well 22/30c-13; Franklin well
29/5b-6 and Glenelg well 29/4d-4; Fig. 18). In
well 29/5b-6 it is overlain by a sharp-based lag
(~ 1m thick) consisting of matrix-supported mud
clasts, pebbles and oyster coquina material. The
lag overlies a thick interval of bioturbated, slightly
argillaceous sandstones (Franklin B Sandstone)
interpreted as lower shoreface to transition zone
deposits. Above the erosive base is a clean sand-
stone (~9 m thick) consisting of a basal lag over-
lain by structureless, clean, fine to very fine
sandstone (~2 m) that grades upwards into lami-
nated or massive sandstone (~6 m thick). The upper
1 m of the laminated sandstone shows an increase
in bioturbation, marking a return to burrowed off-
shore transition zone facies, similar to the facies
that underlies the erosive base. This ~ 9 m succes-
sion forms the basal part of the Franklin C
Sandstone.
The base Franklin C Sandstone erosion surface
removes variable proportions of underlying
reservoir sandstone (e.g. the Upper Franklin B
Sandstone shown with spotted yellow pattern in
Fig. 17). This sandstone has distinctive porosity


Search WWH ::

Custom Search