Geoscience Reference
In-Depth Information
AU
AE
Locality S3
Key
surfaces
Sea-Level
section 1
section 4
section 8
section 10
fall
180
MFS5
180
MTRS
180
170
170
rise
FSf/
MTRS
170
170
160
160
SU2/TS5
E
160
160
150
150
fall
150
150
140
140
MFS4
140
140
rise
130
TS4
130
130
130
120
120
fall
120
120
MFS3
110
110
110
rise
110
100
100
SU1/TS3
overall rise in sea-
level
100
100
90
Sand
Sand
Sand
Sand
Clay
Silt
Gr.
Pbl.
Clay
Silt
Gr.
Pbl.
Clay
Silt
Gr.
Pbl.
Clay
Gr.
Pbl.
Silt
Sandstone
Siltstone
Mudstone
(B)
(C)
(D)
TDSS
WDBE
gneiss
Qz
T
S4
WDBE
FTT
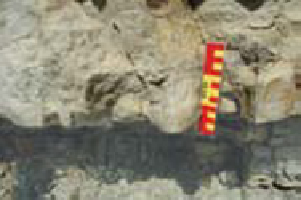
10cm
SU1/TS3, section 8, locality S3.
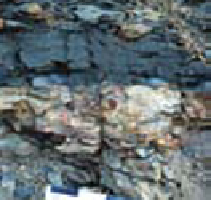
SU2/TS5, section 28, locality N3.
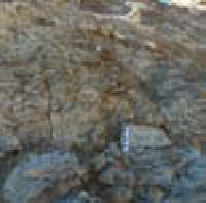
TS4, section 8, locality S3.
(E)
(F)
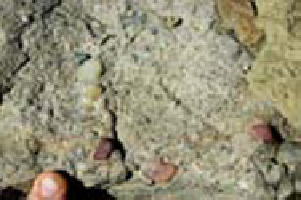
1cm
FSf/MTRS, section 1, locality S3.
FSf/MTRS, section 1, locality S3.
Fig. 5.
(A) Selected detailed sedimentary logs (depths in m) through the upper stratigrahical compartment showing sedi-
mentology, key surfaces and changes in relative sea-level (locality S3). Photos of mixed regressive and transgressive lithofa-
cies overlying selected key surfaces at localities S3 and N3; (B) A matrix-supported conglomeratic bed overlying the SU1/


Search WWH ::

Custom Search