Geoscience Reference
In-Depth Information
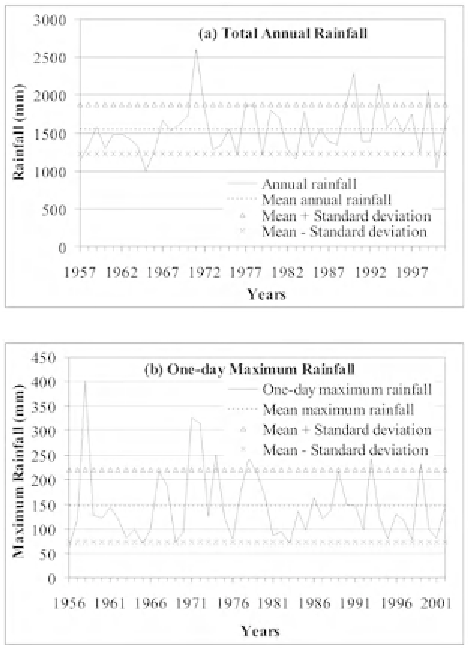
Fig. 7.1.
Time series plots of (a) annual and (b) 1-day maximum
rainfall time series.
percentile and highest value) of the distribution of rainfall data together with
the identification of 'outliers'. The bottom and top horizontal lines in the box
in a box plot indicate the 25
th
and 75
th
percentile, respectively, of the statistics
computed from the observed data. The square within the box represents the
median. The whiskers are lines extending from each end of the box to show
the extent of the rest of the data. The whisker extends to the most extreme data
value within 1.5 times the interquartile range of the data. The values beyond
the ends of the whiskers are called 'outliers'. Further details about the box
plot can be found in Chapter 2 of this topic and USEPA (1998).
It is apparent from Figs 7.2(a, b) that for the annual rainfall series, median
is at the centre in between upper and lower quartiles with the upper adjacent
value larger than the lower one. Only a single mild outlier is found in the
annual series beyond the upper adjacent value. This figure also reveals that
the distribution of annual rainfall data below the median value is more
Search WWH ::

Custom Search