Geoscience Reference
In-Depth Information
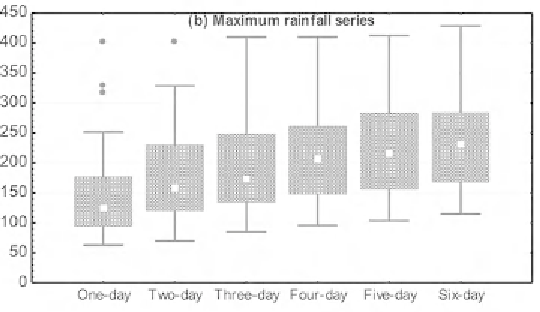
condensed than that above the median. A comparison of the box plots of
maximum rainfall series reveals that more data are lying in the lower half of
the range in all the series (i.e., one-day, 2-, 3-, 4-, 5- and 6-day). In other
words, the lower half range of the maximum rainfall is heavily weighted than
its upper half range. The medians of the one-day, 2- and 3-day maximum
rainfall series are below the centre of the rectangle, whereas the medians of
the 4-, 5- and 6-day maximum rainfall series are at the centre of the rectangle.
Therefore, it can be concluded that the maximum rainfall time series becomes
more uniform in distribution by increasing the number of consecutive days.
Furthermore, mild outliers can be seen in the one-day and consecutive 2-day
maximum rainfall time series, which disappear completely in the consecutive
3-, 4-, 5- and 6-day maximum rainfall time series. It should be noted that in
all the maximum rainfall box plots [Fig. 7.2(b)], the upper whisker (i.e.,
distance of upper adjacent value from the upper quartile) is longer than the
lower whisker, which indicates the less density of data in the upper half range
compared to the density in the lower half range.
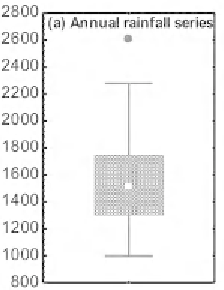
Fig. 7.2.
Box plots of the (a) annual and (b) maximum rainfall
time series of Kharagpur.


Search WWH ::

Custom Search