Geoscience Reference
In-Depth Information
Echo power (dB)
Echo power
700
400
380
360
340
320
300
280
260
240
220
252.0
256.0
260.0
264.0
2
600
500
68.0
2
72.0
2
76.0
400
21
22
23
0
Local time (hour)
(a)
Doppler velocity
400
380
700
360
340
320
300
280
260
240
220
600
200
100
0(m/s)
2
100
500
2
200
400
21
22
23
0
Local time (hour)
(b)
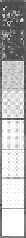
Figure 6.22
(a) Range-time-intensity radar plot obtained looking in the direction of due
magnetic north at a zenith angle of 57.8
◦
for June 8, 1987. (b) Line-of-sight Doppler
velocity for the same period. The velocity corresponds to the angle of the arrow from the
horizontal line as shown on the right-hand side. [From Fukao et al. (1991). Reproduced
with permission of the American Geophysical Union.]
altitude of the layer that reached its low point at 0015 AST. Prior to this, a cycle
of opposite phase can be seen with perturbation north and western drifts occur-
ring before the uplift occurred. The uplift/downdraft cycle is due to the pertur-
bation electric fields in an electrostatic wave for which
∇×
=−
·
=
0. This
was even more dramatically shown by Shiokawa et al. (2003) and is reproduced
in Fig. 6.26. Here, plasma flow (left panel) and electric field vectors (right panel)
measured on a DMSP satellite are superposed on an airglow image. These vec-
tors are consistent with the Arecibo data and the electrostatic wave hypothesis.
Kelley and Miller (1997) even suggested a new wave mode—an electrobuoyancy
wave—might be involved. Saito et al. (1995) investigated midlatitude electric
E
ik
E


Search WWH ::

Custom Search