Geoscience Reference
In-Depth Information
Jan 7, 1997 0001
Mar 8, 1997 0218
Nov 29, 1997 2241
30-38R
K
p
4.0
35-65R
K
p
1.7
K
p
2.0
52-80R
(a)
(b)
(c)
Dec 21, 1997 2036
Jul 26, 1998 0318
Sept 28, 1995
N
W
E
S
100-120R
K
p
0.7
K
p
2.3
K
p
4.3
(d)
(e)
(f)
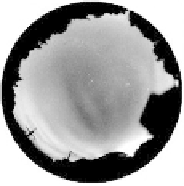
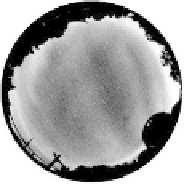
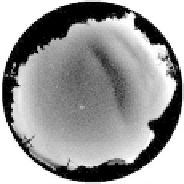
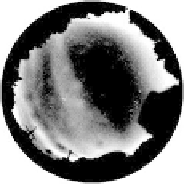
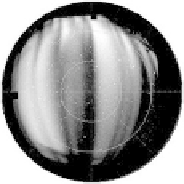
Figure 6.23
Summary of events observed from Puerto Rico (top row and bottom left),
Hawaii (bottom middle), and Christmas Island (bottom right, courtesy of M. Taylor).
Each image has been standardized so that north is at the top and east is to the right.
[After Kelley et al. (2002). Reproduced with permission of Elsevier.]
0
180m/s
330
30
120 m/s
300
60
60 m/s
270
90
120
240
150
210
180
Figure 6.24
A compass plot showing the direction and velocity of structures observed
using the all-sky imagers. [After Garcia et al. (2000a). Reproduced with permission of
the American Geophysical Union.]


Search WWH ::

Custom Search