Geoscience Reference
In-Depth Information
Feb 16, 2002 22:17 LT
Feb 16, 2002 22:57 LT
Feb 16, 2002 23:29 LT
Feb 17, 2002 00:09 LT
2000
1500
1000
500
275
270
265
Magnetic longitude (
8
E)
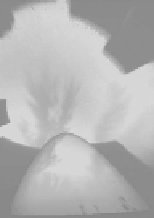
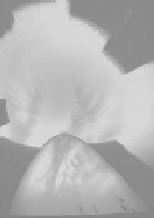
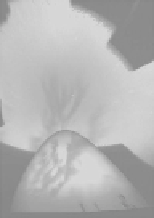
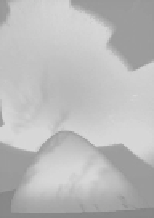
Figure 4.7b
A narrow field-of-view camera looking south from Hawaii parallel to the
magnetic field provides a two-dimensional view of the bottomside near the magnetic equa-
tor while the collocated all-sky camera shows that the plumes map to latitudes poleward
of Hawaii. The image is in the 557
7 nm oxygen line. GPS satellite signal scintillations
occurred when the line of sight penetrated a dark region. [After Kelley et al. (2002).
Reproduced with permission of the American Geophysical Union.]
.
Fully developed equatorial storms often display remarkable internal struc-
ture, some of which is periodic. We have already seen long-period modulations
of the whole scattering region (e.g., Figs. 4.1 and 4.7a), which certainly must
reflect long-wavelength variations as well. Somewhat shorter-scale organization
of radar echoes is seen in the “downleg” miniplumes seen in Figs. 4.1 and 4.2
and in the airglow pictures in Fig. 4.7b. The horizontal spectral data of Fig. 4.5b
show a peak in the 400-600 km range and a secondary peak at 50 km. It is very
tempting to associate the latter with the miniplume spacing. Some evidence for
vertical periodic behavior is seen in Fig. 4.1—for example, at 2145 when three
bands of irregularities are detected with vertical separations of about 70 km.
A more striking example is presented in Fig. 4.8. Here, many examples of near-
horizontal striations are seen. The various cuts shown have been Fourier analyzed
and indicate a characteristic separation of 50 km. This event had three plumes
between 2010 and 2110 LT.


Search WWH ::

Custom Search